Dan Robinson's Copyright & DMCA FAQ: How the crime of copyright infringement took $1 million from me and shut down my operation
 Introduction and Overview | Frequently Asked Questions | For Photographers and CreatorsI've been very blessed in my 32 years as a freelance photographer and cameraman covering storms and weather. I'm very thankful for everything I've been privileged to capture and experience. It's been an incredible life of adventure. I've witnessed and been a part of far more than I ever dreamed that I would when I started. I say that to preface everything I'm about to go over in this article. I don't want to seem like I'm ungrateful or just complaining for the sake of complaining - far from it.The issue I'm about to cover is something that has had a devastating impact on the operations and financial well-being of not just me, but nearly all of my colleagues in this field. It's become a crippling burden not just because of the impact it's had on my ability to earn an income, but because so few people understand what is happening and even perceive me as the 'bad guy' in this situation.
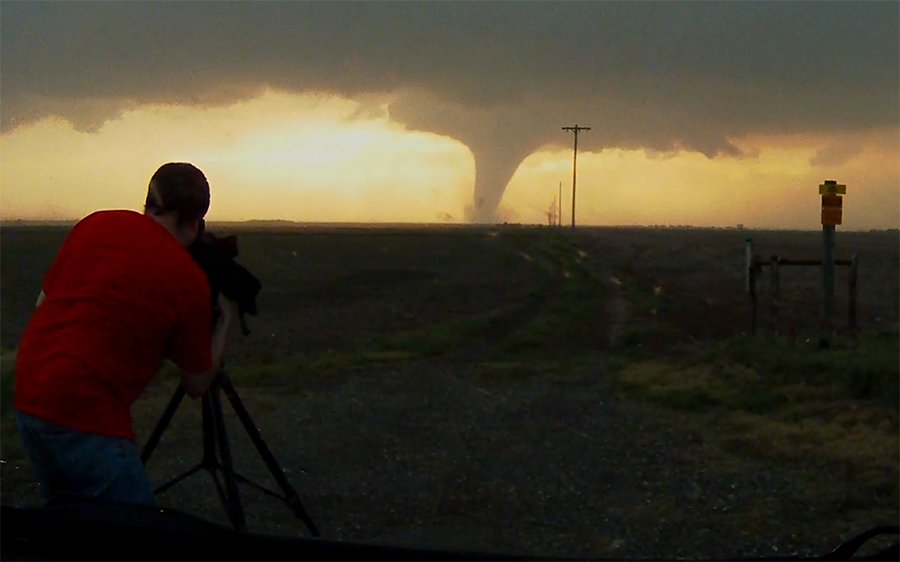
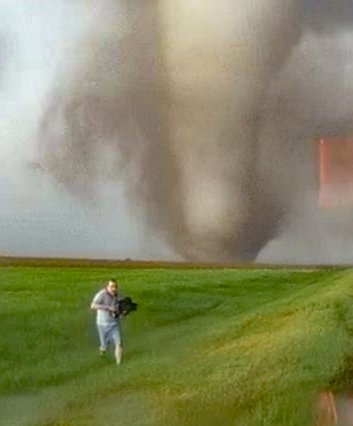
I shoot all of the photographs and videos on my Youtube channel and website on-location using my own cameras. I cover the costs of the entire operation: equipment, vehicle mileage, insurance, taxes and more. I take all of the risk in being out in these dangerous conditions. And I do all of the work: Many of my trips require 24-hour days of being out in the elements, doing it all during the time off from my day job. I sleep in my car on most of my trips. Between my IT job and my cameraman job, I sometimes go two or three months without a day off. All of that expense, all of the hustle, all of the striving to capture high-quality dramatic shots and be the best in my field, all of the fruit of it is going to the thieves and the social media companies that collude with them. I'd be insane to keep putting myself through what I've been doing only to continue enriching the pirates and the social media companies that not only profit even more from their actions, but put roadblocks in front of me when I try to fight back (even portraying me as the bad guy). I apologize for how long this page is, but this issue is a deep rabbit hole that is difficult to believe if you've never encountered it. There really is a lot to go over. Here's a quick summary of the items I'm going to cover in detail:
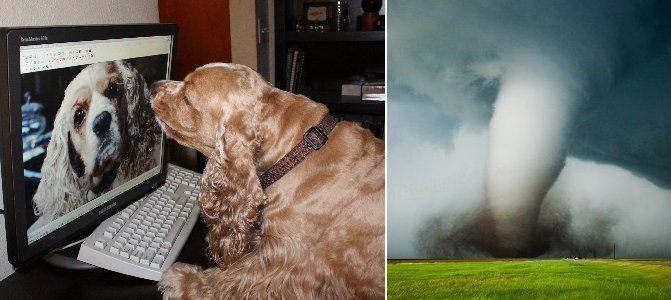
So, with that, let's get right into it: Video and photographs are financial assets.Let's start with a foundational fact that isn't yet widely known or understood: viral and compelling video, photo and literary content is a valuable financial asset, just like your investment portfolio, stocks, a 401k or even real estate. That can be newsworthy footage from professional photographers like me and my many colleagues, or even just a cute video of your puppy or a funny moment with your friends or family captured on your cell phone.The value of content can vary based on several factors, including rarity, the number of competing angles of the same event and picture/video quality - but generally speaking, the lifetime value of a typical viral video can be well into the five-figure range. That represents a potentially life-changing amount of money for the person that shot it. Viral content items are real, tangible assets that can be converted to cash. This value is the backbone of how television, movie studios, newspapers, radio stations and other media outlets generate their fortunes. It's how professional artists, cameramen, photographers, authors and more have been able to earn a living doing what they do. |

 To put it simply, my work (photographs and video footage) are earning more income than they ever have in my career - but almost all of that is going to content theives and the social media companies that profit from and support them. It's been going on for most of my career, and has grown out of control to the point I do not have the revenue to keep operating.
 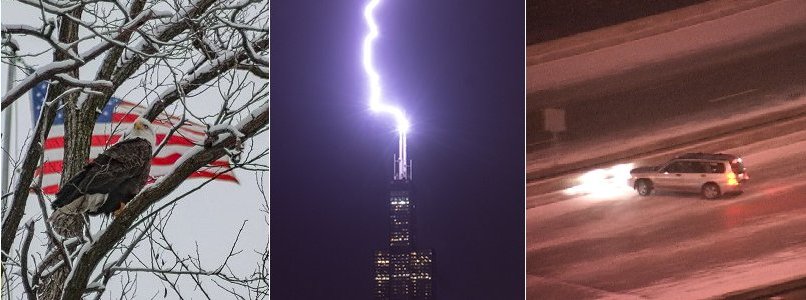 |
| Videos and pictures that people want to view have significant value - everything from cute/funny pets, newsworthy events, or rare and dramatic captures. |
| There are two ways that the financial value of photos and videos is converted into income. The first is something called licensing. This means getting paid a fee in exchange for granting the rights for your work to be used in a production or publication. I have been licensing videos and photos for books, magazines, advertisements, company web sites, news broadcasts, professional productions on television, and more recently online (including Youtube) for decades. You can see some of my credits here. What this means is that the publisher, production company, TV network or Youtube channel pays me a fee to use my video in their final for-profit product. It's a win-win: they get quality compelling footage or imagery that will enhance their production and help it make them money, and it helps me earn an income that lets me pay my bills and continue producing new footage.
Footage and photos are licensed because cameramen like me capture rare and challenging shots that would not be possible or economical for a business or production to shoot with their own crews. It costs much less to pay me a license fee to use my shot of a tornado than their only alternative: sending their own camera crew out for weeks trying to get the same type of shot (and with no guarantee they'd be successful either!).
A Youtube video is no different from a television production. An online-published video can easily get more viewers than a documentary on a television network! The end result in those infringement cases is that my footage helps the channel owner make a large amount of money, but I get left completely out of that successful venture: many times to the tune of thousands or even tens of thousands of dollars. Many businesses take and use my photos on their web sites, product packaging or even billboards without paying me the license fee that I would have normally earned. None of those losses are "throwaway" amounts of money: each one is a loss of anywhere from hundreds to tens of thousands of dollars (or even more).
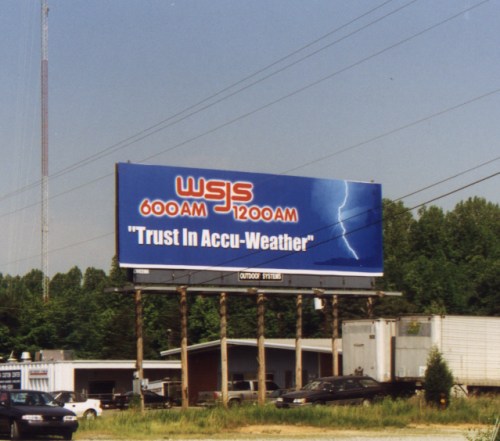 One of the first infringements of my photos that I discovered while driving through North Carolina in 1998. And no, I was never paid for it. The second way financial value is extracted from photos and video is through advertising. In a nutshell, good content equals viewers, and viewers equals advertising revenue. Today, most of the advertising dollars made on content are in the online realm. Advertising on traditional outlets like television and print media have almost entirely been replaced with online advertising. But that doesn't mean that content has become less valuable. It just means that content's conversion into cash is happening on the internet instead of at the TV studios or printing presses. The biggest and most profitable companies of our day are the social media platforms. All of that money is coming from advertising revenue generated from the consumption of video, photo and even text content posted to those platforms. Facebook's current profits far surpass even the biggest TV networks and Hollywood movie studios:
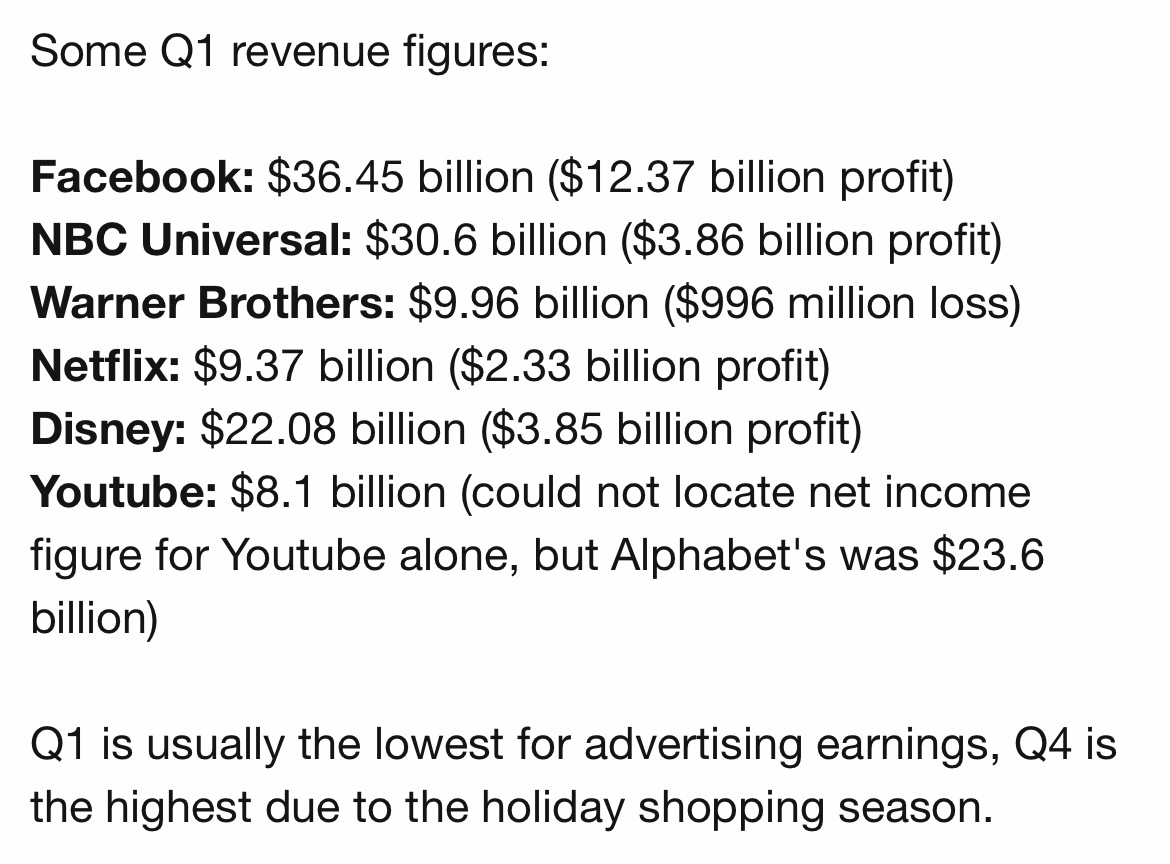 2024 Q1 revenue of social media and television media outlets That's real - not hypothetical - money being made on content. All of that content comes from people like you and me posting videos and pictures. Even if something we post doesn't go viral, it's earning *some* revenue for the platform. If and when something we post does go viral, it starts earning significant money for the platform. A video that gets millions of views can generate thousands or even tens of thousands of dollars in advertising revenue. How do I know this? My videos earn this type of money when they go viral on my Youtube channel. Likewise, your videos do the same when they go viral. The platforms count on you not being aware of this because they're getting essentially a three, four or even five-figure donation from you when you post something that gets a lot of views. Social media companies take advantage of the fact that you are happy watching all of those likes, shares, views and comments roll in while being unaware of all of the money being made from that process. That engagement metric bar below your post that shows all of the likes, shares, comments and views? It really should look like this:
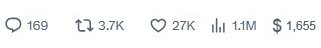 Social media engagement bars should be like this, showing you how much the platform made on your posts. Would you feel the same about your post going viral if you always knew that last number? The platform may not be showing it to you now, but it's very real - it's the cash exchange from the value of your photo or video being transferred to the platform's bank account. If the content is stolen like it often is, that's the photographer's income being given to the platform right before your eyes. "Exposure" doesn't help creators' content, it only takes viewers away from the originals.It matters where a piece of content gets viewed or read, because that's where the advertising cash exchange happens. 'Exposure' for a piece of content or a content creator doesn't have any value. It only matters that the revenue generated goes to the owner of the content at the time of viewing, meaning on that creator's channels or outlets. Only on the creator's outlets does he or she receive the revenue and the subscriber growth. If the content is viewed elsewhere, the revenue and growth goes to that other channel or outlet, not to the original creator's.
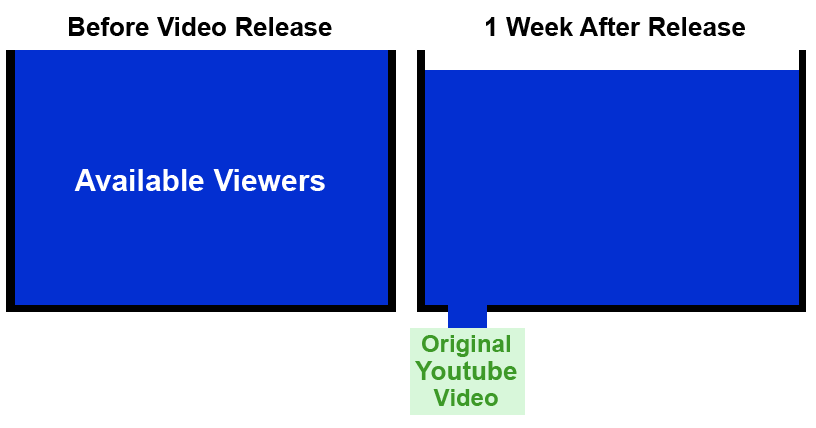
You can envision the finite pool of viewers in the cycle of a viral video like a tank of water. When a copy of a video is posted, viewers start flowing to it. When stolen copies are posted, viewers begin flowing to those simultaneously, pulling from the same pool. Many times the flow of viewers to a stolen copy becomes greater than that of the original. Multiple stolen copies can receive ten times the viewers of the original in a very short amount of time, draining the pool of viewers.
|
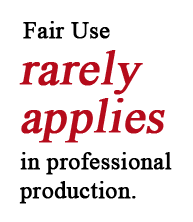 Licensing has always been the norm in publishing, advertising and media production. It's not just something only I do, it's the way it is across the entire media and publication realm. Nothing is ever taken and used "under Fair Use" because Fair Use doesn't apply in these situations. I'll go into the Fair Use issue in more detail later on this article. What is happening now is big Youtube channels and social media accounts are just taking my footage and using it in their own productions without paying me a license fee. Many do this because they are misinformed about what Fair Use is, mostly via the myth that editing and commentary makes *anything* Fair Use.
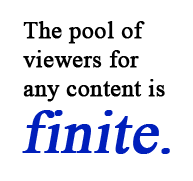 It's also important to realize that viewers for any given piece of content are finite. A movie will only sell a certain number of tickets, for instance. Most people will watch a viral video online once. If that view was on a stolen copy, that viewer is lost to the original creator forever. That viewer is not going to seek out the original copy to watch it again, even if they are provided with a direct link to it later (which rarely happens to begin with). This is why TV networks are so protective of what channels broadcast their best content and why the NFL controls so tightly where you can watch the Super Bowl. It's fundamentally critical where something gets viewed, not just that it gets viewed.
 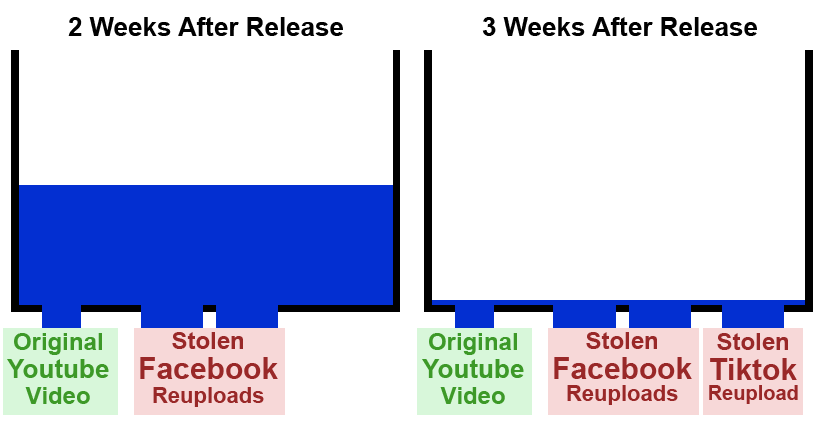 | |
| Stolen copies of a video compete with the original for viewers. The 'exposure' doesn't help the original, it always harms it by permanently removing those viewers from the available pool. | |
|
What frequently happens on social media is that people take videos that aren't theirs and upload them to their accounts. Sometimes they're doing it in what some might say are 'innocent' motives. They're intoxicated by all of the likes, shares and comments that it brings them without being aware of the harm of what they are doing to the owner of that content - which is like a "reverse Robin Hood" act, taking the financial value of the video from the poor (photographer) and giving it to the rich (the platform). Others aren't so 'innocent': we know there are organized crime operations doing this, the same type of piracy outfits that sold bootleg VHS cassettes and DVDs 30 years ago. When an account is monetized on a platform, this means the platform shares some of the money they make with the uploader. Those pirates take advantage of that. Most accounts are not monetized, which means the platform takes all of the advertising revenue earned. Either way - whether it's an 'innocent' uploader or an organized piracy operation, they both have been responsible for the vast majority of the losses I've incurred and are still incurring right now as you read this. When a photographer's video or photo is taken and posted on these platforms, it is usually one of their better ones. That means that it ends up going viral and as a result, pulling from that video's finite pool of available viewers and making the platform many thousands of dollars in each instance. Some of those uploaders are monetized piracy accounts, meaning that a large cut of that money goes to them. Again though, a non-monetized account still generates advertising revenue for the platform, so even if a non-monetized uploader doesn't earn money, the platform does. It might surprise you to know that much of the viral content you see on social media is stolen. That page or subreddit you follow that constantly posts viral photos and videos from different sources? They're likely all stolen, and the cash conversion generated from the advertising is all going to the platform (with a cut going to the uploading account if they're monetized). Our current copyright laws make it impossible to handle the infringement problem. Our current copyright law governing online infringements, the DMCA, does two things: one, it places the burden of enforcement and takedowns on the owners of the content. That means that it's up to me to find all of the stolen copies of my videos and file legal notices to take them down. Second, it absolves the platform of any responsibility or liability for the infringing uploads as long as they take them down when a legal notice is received. That means that even if they earned tens of thousands of dollars on a video of mine that gets uploaded, they don't have to pay me any of it and can't be penalized at all as long as they take the video down when I discover it. Our current copyright law governing online infringements, the DMCA, does two things: one, it places the burden of enforcement and takedowns on the owners of the content. That means that it's up to me to find all of the stolen copies of my videos and file legal notices to take them down. Second, it absolves the platform of any responsibility or liability for the infringing uploads as long as they take them down when a legal notice is received. That means that even if they earned tens of thousands of dollars on a video of mine that gets uploaded, they don't have to pay me any of it and can't be penalized at all as long as they take the video down when I discover it.
Under our current law, the only entity that can be practically held responsible for an infringing upload is the uploader. That means any lawsuit must be filed against the person who uploaded the video. This is often impossible because many are individuals who did not receive any of the money earned from the upload. Attorneys just won't take cases against those kind of defendants because there is no way to even cover the legal fees, much less recover damages. And the way the law works, it is exceedingly difficult to require or demand that the platform pay me the money they earned on the upload. Some of the worst offenders are overseas, where legal remedy is often also impossible or impractical. In all of those cases, that cash value extracted from my video is entirely and permanently lost - I will never see a dime of it. Furthermore, the social media platforms have a financial incentive to make the takedown process as long and as cumbersome as possible. They often employ stalling tactics for the takedown notices, like requiring additional documents or evidence even when the case is very clear (like the link to my original Youtube copy). They often take their time - weeks or even months - processing a takedown before removing the offending video. Most of the time the takedown doesn't complete until after the video's viral cycle is over. By then, the stolen copy has already received the bulk of its views and made the platform their money on it.
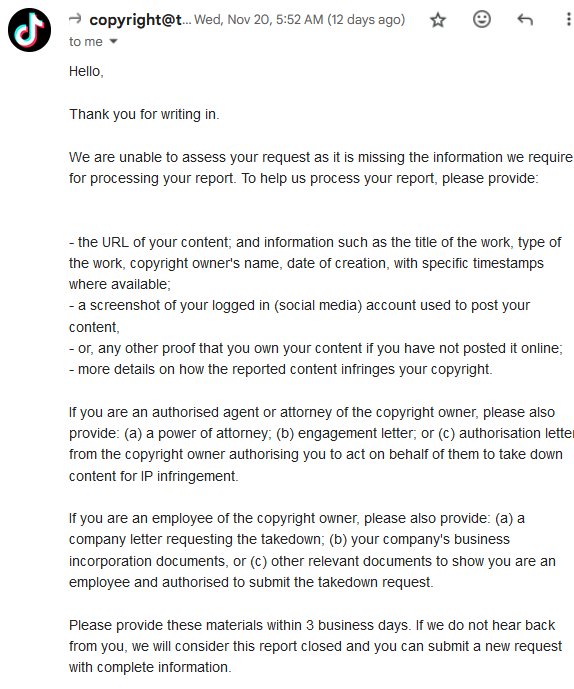 An example of blatant stalling on actioning a DMCA takedown by Tiktok. My original takedown notice is below.
 Original takedown notice sent to Tiktok that resulted in the above reply. They rejected it even after I provided the registration certificate and my video's original URL. Losses from infringement are real, impactful and devastating to independent creators.My total lost revenue from copyright infringement of my work in the past 15 years has exceeded seven figures. Yes, you read that right: that's well over $1 million USD. Enough to buy a house and fully fund my retirement, all taken from me by content thieves. Those funds are now in the hands of thieves and social media platforms. Again, that is the minimum figure based on the hundreds of thousands of infringement instances that I know about. That total includes license fees that I would have received from those uses of my photos and videos as well as advertising revenue for views of infringing copies of my videos on social media.On just Facebook alone, 100 times more people have viewed infringing copies of my videos than on my Youtube channel in its entire lifetime! On Tiktok, I'm seeing infringements at a rate that may have started approaching those numbers as well. And there are likely far more infringements that I've not discovered yet: finding all, or even a majority of, infringements with my daily manual searches is impossible. The social media platforms refuse to grant me access to the automated tools that are the only way to track down a larger number of reuploaded videos.
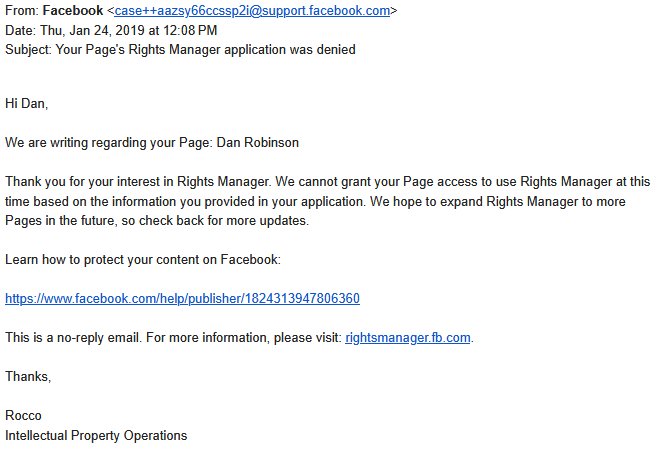 One of the rejection emails from Facebook when I tried applying for access to their automated Rights Manager tool, which would have allowed me to find hundreds of thousands of otherwise impossible-to-find stolen copies of my videos. The impact of that infringement on my life has been devastating and crippling. In September of 2025, I had to shut down my professional storm chasing operation due to the endless copyright infringement. Before that, instead of being able to do my photography and video full time, I had to rely on other part-time and sometimes full-time employment to keep my bills paid. it's not that my work isn't generating revenue. Quite the contrary - it's generating more than it ever has in my career, but that money is not coming to me - it's going to the social media companies and the thieves who reupload stolen copies of my videos and photos. You see, I am not a mega-corporation like Disney or Warner Brothers that can absorb that kind of loss. Neither are many of my colleagues who also are going through the same thing.
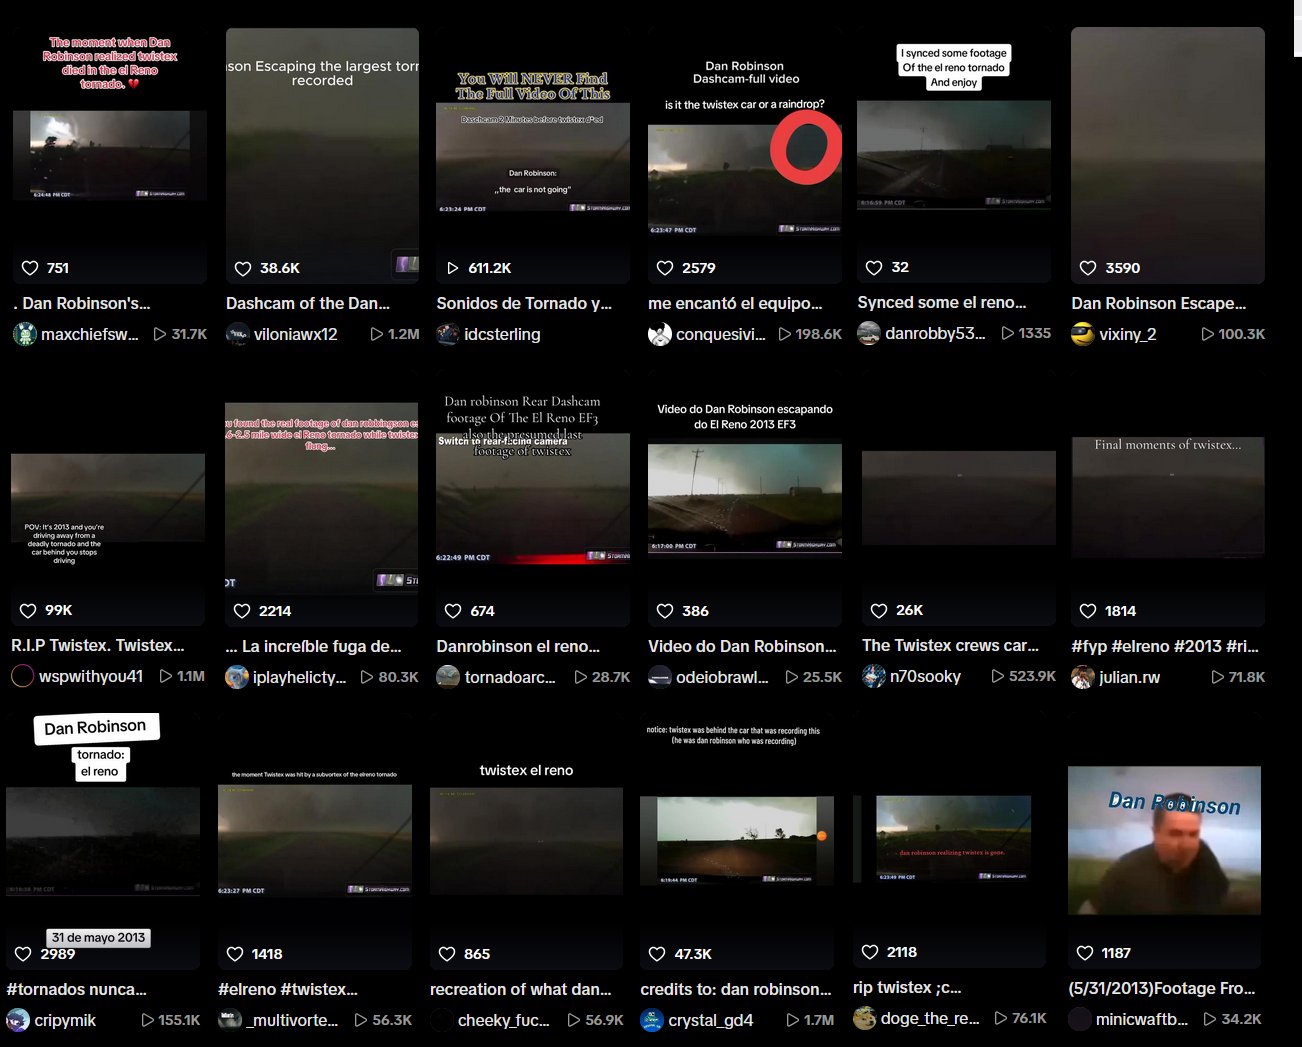 A tiny example of the endless infringing reuploads of my El Reno tornado footage on Tiktok, with countless copies getting millions of views. Just the tiny sample represented in this screenshot has received more views than my original video has it its lifetime! These do not help my Youtube channel at all. My original video gets 15,000 views per month and only has 2.4 million lifetime views since I posted in in June of 2013. To make matters worse for creators, infringers who find themselves on the inevitable end of a (well-deserved) copyright strike or lawsuit will play the victim to their fan bases. Infringers quickly and easily grow large, loyal followings because they are providing viewers with so much quality (stolen) content. They then weaponize their fan bases against the photographer by claiming the takedowns and/or lawsuits are "extortion" or "copyright trolling". After everything a photographer has suffered from infringements, they often find themselves painted as the bad guys in their battle against content theft, with the unknowing public hurling threats, insults and worse. I have received death threats after a copyright case involving a popular multi-millionaire Youtuber. It is from that place that I have launched an all-out war on copyright infringement in recent years, and I have recently ramped up that effort significantly. This is a task that I take no pleasure in and of which I would prefer to not have to take part, but it must be done to counter this existential threat to my life's work. I have signed on with rights management agencies and legal representation to attempt to both take down infringing copies of my work and recover some of that lost income. Those processes typically progress very slowly and involve significant costs of their own: attorneys, court costs, numerous copyright registrations and services from other professionals. Even after all of that, it is almost certain that I will never recover even a fraction of what has been taken from me.
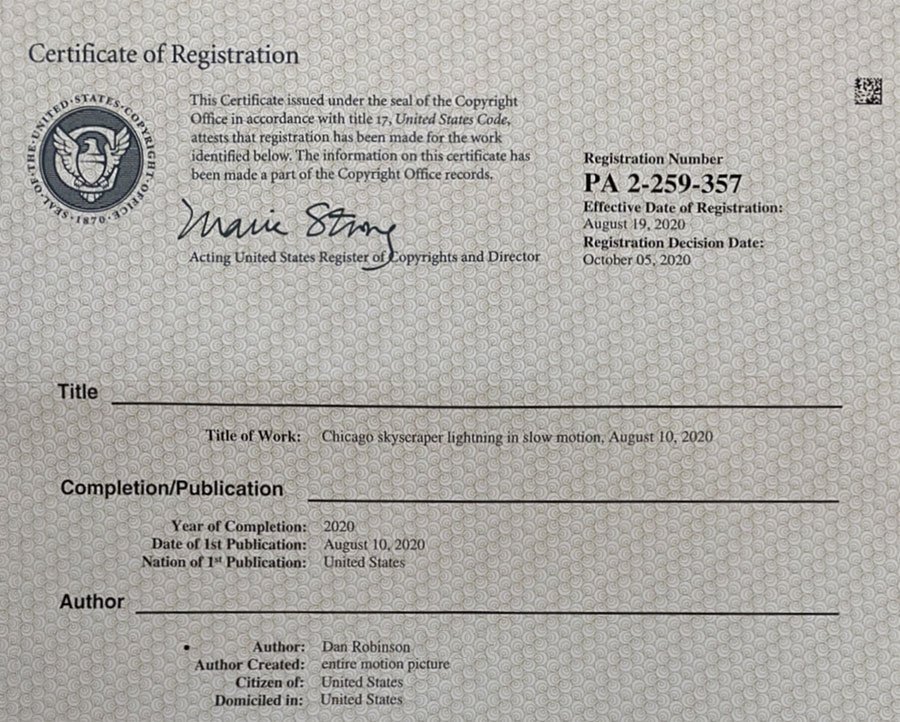 One of my U.S. Copyright Office registration certificates. Even with the help of the professionals I've enlisted, I spend at least one hour per day on infringement-related matters. For the most part, that is unpaid time. Artificial intelligence threatens to add yet another avenue for creators' work to be exploited.As if all of the above wasn't already bad enough, AI systems are the next big additional threat to creators. Generative AI has ingested the entire body of work of countless creators for the sole purpose of replacing their work in the market. For example: without the thousands of photographs and videos ingested into these systems from dozens of storm chasers, AI would not be able to produce the realistic images and videos of tornadoes we are already beginning to see being used by businesses and productions in place of stock footage and photographs.Social media companies are contracting with AI firms to train on user-generated content, or to produce their own internal AI systems. As I've already covered above, much of this content has been stolen, meaning countless photographers, artists and other types of creators are seeing their works ingested into these systems, without their permission and against their will. Search engines like Google are beginning to employ AI summaries of web pages displayed on the results pages, which allow users to consume information written by the site's authors without ever having to visit the web site it was taken from. Organized crime is involved with a large part of the infringement problem.A significant amount of piracy comes from organized criminal groups around the world. These organizations have data centers with high-end computer hardware that automatically detect videos that are beginning to go viral. They then download these videos, crop the watermarks out, use AI upscaling to get the cropped video back to a normal size or even 4K, then upload copies of these videos to all of their monetized pirate profiles on social media and Youtube. Their pirate accounts and channels grow large, loyal followings very quickly thanks to the frequency and volume of high-quality content being posted in a single convenient place. The ringleaders of these operations live in opulent wealth, funded on income diverted from me and many of the people in the storm chasing and content creator community.Astroturfed social media postings and comment threads, along with suspiciously-timed activist blog posts, shill for the relaxation of copyright laws and vilify any creators fighting the enterprise. Any time legal consequences loom, piracy groups and large infringing channel owners portray themselves as victims to their followings, knowing their user base will proceed to make threats of violence and death against anyone who dares send takedowns and lawsuits. This intimidation is often effective at persuading the creator to back down from their legitimate and lawful claims. Many of the social media platforms and video sharing sites also run interference for these operations. They stall, or simply don't action, legitimate takedowns. They secretly "backdoor" the pirate channel owners tips about pending legal actions to shut down accounts and freeze the illicit funds earned, allowing the pirates to delete videos that have incoming strikes and move money out of their targeted accounts. Many regular social media users end up being unwitting associates of these mafia-esque groups, joining in on the threats, intimidation and activism against any creators and their allies fighting them. Yes, it's difficult to believe. It sounds like the plot of a Francis Ford Coppola film. But it's very real - and still happening at this very moment to countless creators across this space. Fellow photographers have been at the forefront of exposing much of this activity, you can read some of this in the Copyright Alliance articles at the end of this page. If and when the U.S. Department of Justice should ever investigate this enterprise, it would not take long to find RICO-level malfeasance that many of the biggest social media platforms are knowing participants in. Frequently Asked Questions and ObjectionsI've been involved in many debates with infringers, their supporters and anti-copyright activists for years. Many people in the general public also don't have an understanding of what photographers have been going through and why I'm taking the actions I have. These are my answers to the most common questions and objections I've dealt with.Why are you so concerned about copyright?I'll get into these reasons in more detail, but here is a short summary:
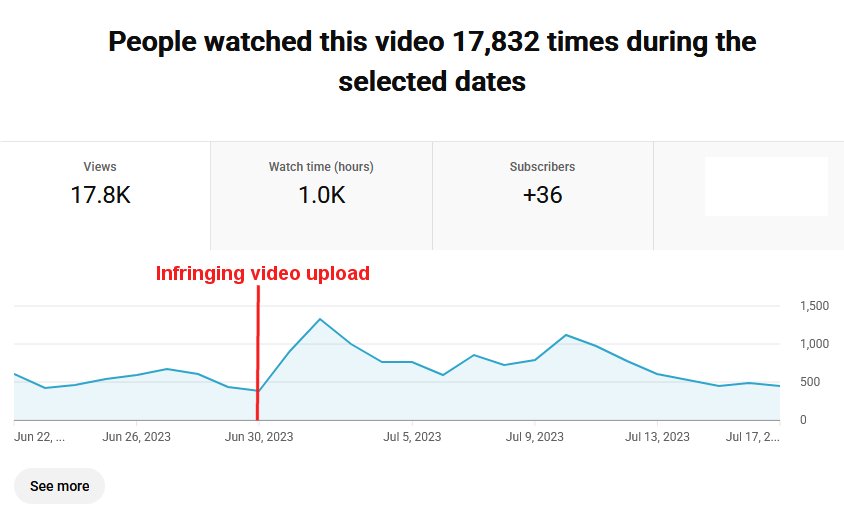
Copyright infringement was an existential threat to my entire operation, and the sole reason I had to shut it down in 2025. I already covered that in my intro above. The lost income from infringements was the primary reason I was not able to continue being a photographer and cameraman full time, and was the only reason I had to ultimately shut the entire operation down. If I never issued any takedowns or fought copyright battles, the end of my operation would have happened a decade ago. I'm bearing all of the costs and risks of capturing my content. I spend tens of thousands of dollars a year on fuel, hotels and vehicle costs, take dozens of unpaid days off of work, maintain expensive equipment and relentlessly spend 12 to 36 hours at a time in harsh weather to capture my images. I finance my own operations - I am not sponsored or supported by anyone, nor am I wealthy with lots of disposable income. My images and video that result from all that work and expense are my main 'product' that I sell, and those sales are how I am able to pay my bills and continue doing what I do. Competing copies of my photos and videos on the web and on social media take traffic away from the legitimate copies here on my web site, my Youtube channel and my own social media accounts. Competing copies often go viral instead of my original. I receive no benefit from that so-called "exposure" - more on that topic follows below. No matter whether it's an organized piracy operation or just a teenager with a weather page, all competing copies equally do serious damage to my income stream.
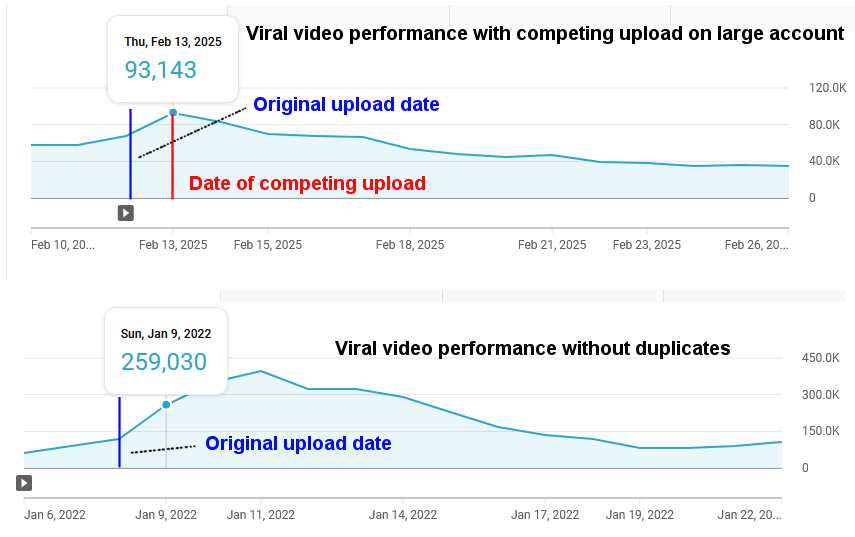 Above: The effect of competing infringing copies of a viral video. These captures from my Youtube analytics show video traffic data from a viral original without competing copies (bottom) and another (top) with a competing copy posted soon after the original. Note the scale of the vertical axes!
Many times the infringing copies rank higher in search engines than my original and sometimes cause my original to not show up at all in search results, including Twitter and Google Images searches. I'm repeatedly having to file takedowns for images that outrank me in image searches - if I didn't, the infringing copies would take more than half of all organic image search traffic away from my site. On Youtube, a competing copy (or video incorporating a significant amount of my footage) can completely replace mine in recommendations, searches and related video slots. Youtube's automated systems can also (mistakenly) deem the stolen copy as the original and consider *mine* the stolen one, causing a loss of monetization. All of those become more likely if the thief's channel is larger than mine.
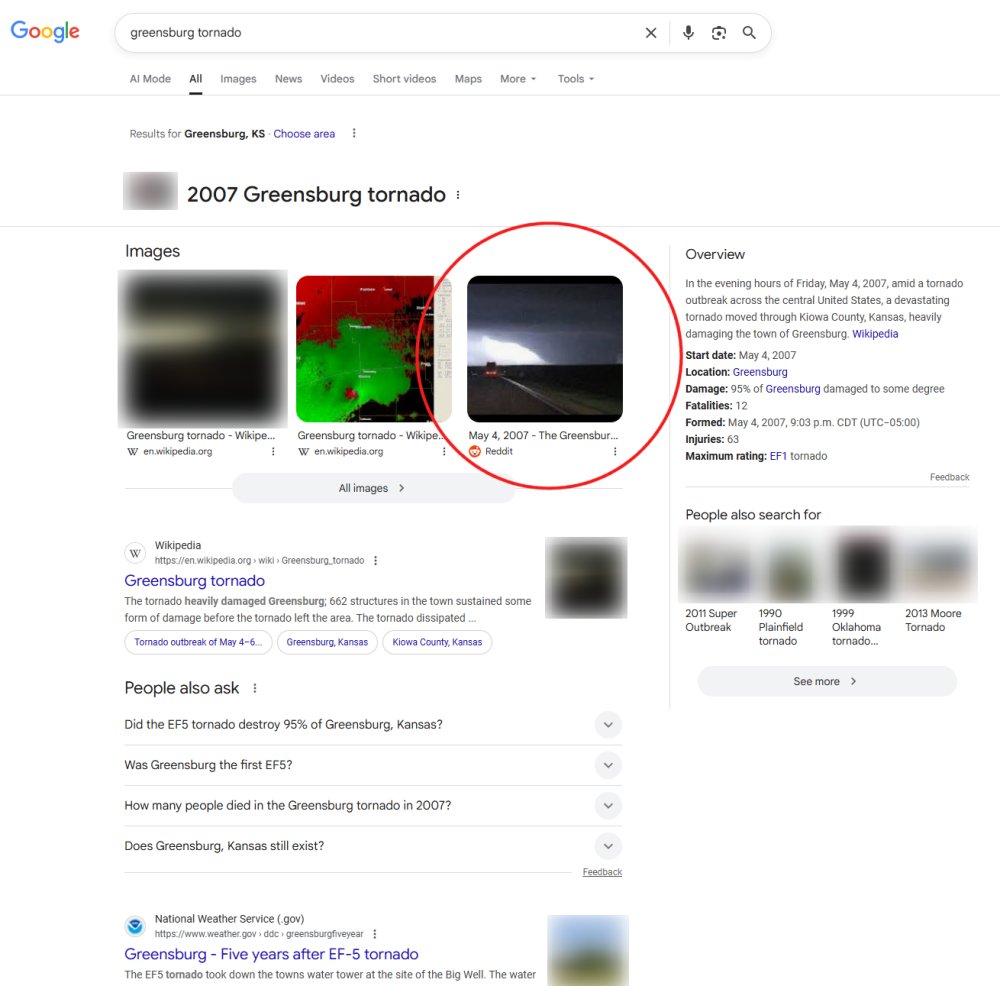
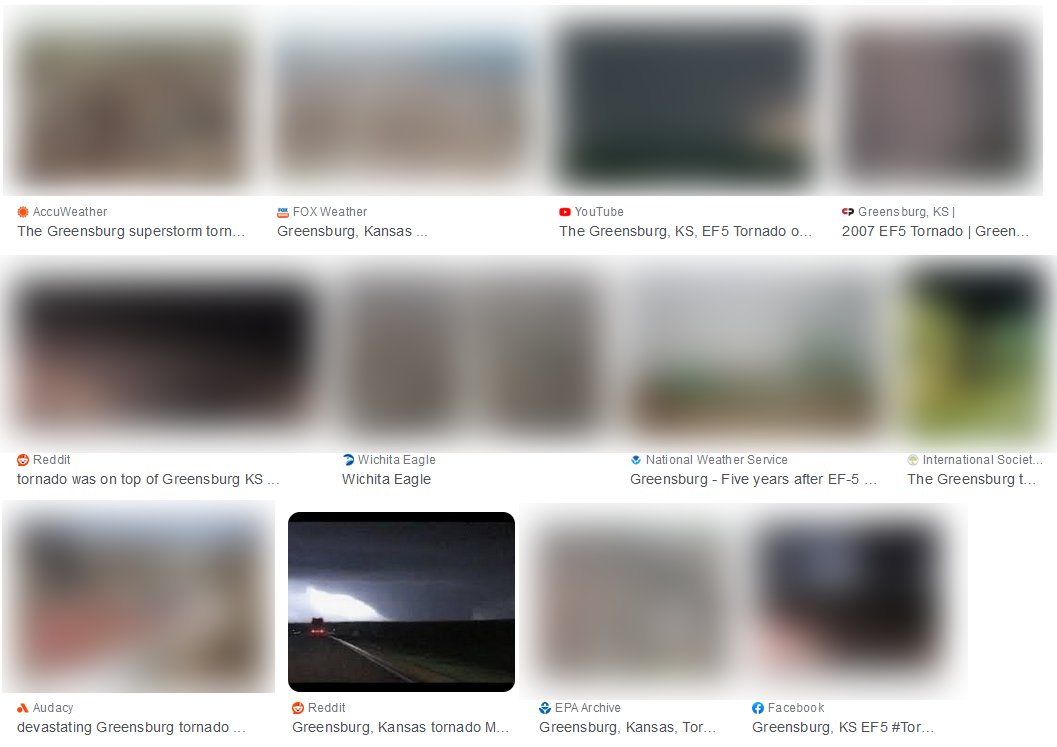
Above: This example is illustrative of how reposts outrank my originals and sometimes even bump them from results altogether. This repost of my Greensburg tornado photo on Reddit was at the top of the Google search results page, while my original page or image doesn't appear in the results at all. Below: Another (separate from the above) repost of my Greensburg tornado image showed up 10th in Google images, while my originals did not show up at all.
Credit lines, mentions, compliments and accolades bring no tangible benefit to me and are not acceptable substitutes for payment. I cannot use a photo credit to fill up my gas tank.
Why didn't you contact me first? I would have taken down your photo/video if you'd asked.It's always interesting that many infringers expect me to contact them first before issuing a DMCA takedown, when they couldn't be bothered to contact me for permission to use the video/photo in the first place! The answer to this question is very simple: contacting you takes too much time. That is time that your copy of my work sits there and gets indexed by search engines, and racks up views and shares on Youtube and social media in direct competition with my original copy. Consider that I deal with sometimes a dozen or more infringements of my work per day. I'm supposed to do tons of extra work to keep track of all of that, all the while an infringing video is making the thief thousands of dollars a day while it racks up millions of views?
Will you please retract your copyright claim so the strike on my channel will be removed? I'm really sorry!No, I will not retract any copyright claims. A strike is not only fully reasonable, many times it is just the starting point of an infringement recovery operation. It's quite incredible that infringers that use some of my most valuable footage to make money for themselves illegally (while competing directly with me for views on my own videos) expect me to just retract a claim and call it a done deal. I have to spend at least an hour a day searching for these infringing uploads and manually sending the takedown notices. That is time lost from my life and work that I'm already having to spend, in addition to the lost income from the infringement itself.
Consider that a single copyright strike on most platforms like Youtube expires in 90 days. Channels only get terminated if they get three strikes within that timeframe. A first strike is a warning that gives a channel owner that made a legitimate mistake (a rare circumstance in my experience) a chance to correct their actions before getting another strike. For a channel owner that has truly learned their lesson, that first strike provides them with the opportunity to clean up their channel by removing and/or obtaining permission/license to use all infringing material. Afterward, the strike will expire after the 90 days, and their channel will go back into good standing. But that's never what happens. No, these channels only beg for a strike to be retracted because they have no intention of removing infringing content or even to stop posting it in the future. No channel I've ever issued a takedown for has ever removed the rest of the stolen material they've posted. Me retracting the strike would just enable that channel to continue stealing from others. Other photographers in my niche who deal with this issue have learned that the "begging for a strike retraction" is oftentimes a stalling tactic employed by organized piracy operations to keep the channel (and its income) going. They fully expect the channel to ultimately be taken down with strikes, and their begging for retractions often works to buy them more time before that happens. Even worse are the channel owners that employ the strategy of weaponizing their fan bases against photographers who issue takedowns. This is also something done by the organized piracy groups. After getting a strike, these oftentimes-millionaire channel owners post sob-story videos portraying themselves as the innocent victims, while the small-time photographer trying to pay for his or her rent and groceries is labeled the evil tyrant "copyright troll". I've been on the receiving end of many of these hate campaigns. In any case, I am not going to retract a strike unless a legal settlement is reached that includes that as part of the final agreement. When you post something online or on social media, it becomes public domain, meaning anyone can use it.This is completely false. Seriously, how does an idea so outrageous come to be and become so widely believed? The most basic, kindergarten-level reading on copyright would put this to rest. This is one of the lies spread around by organized piracy cartels and their advocates. It's designed to sway public opinion toward them and vilify the people who do all of the work, bear all of the costs and take all of the risks to produce valuable material.
Copyright law, since its inception 300 years ago, codifies that a person immediately owns the copyright to any photo, video, artwork, writing, or any other work the moment they create it. Posting that work to the internet does not relinquish those rights. If you somehow still believe that is wrong, then I'd invite you to find the source for your belief and get back to me. I'm giving you great publicity and exposure, right?That statement is a myth at best, and a lie at worst. Creators don't benefit from "exposure", they only benefit when their work is licensed or viewed on their official channels. As I illustrated with the "water tank" graphic above, "exposure" via competing copies diverts viewers and revenue from the creator, harming them, not helping them!
Ever since the dawn of publication, media and entertainment, "you'll get great exposure" has always been a go-to line by con men, shady talent agencies and ruthless media execs looking to take advantage of writers, actors, photographers, artists and more. And not surprisingly, it's now being used and popularized against creators in the online world. Every creative professional has heard this line, likely fallen for it when they started and (hopefully) quickly learned the hard way that it's a scam when that "exposure" yielded them absolutely nothing. I get all the publicity I need from my web site, Youtube channel, social media pages and when my work is purchased legitimately for publication/broadcast. Publicity and exposure does not do a thing for me. I know from experience! I've had interviews on national and international television, credits in prominent TV shows, magazines, newspapers and books. I never get extra web traffic or sales from those! The only benefit I received was from the license fee I was paid for each use. Think about this for a minute. How many times have you Googled the name of someone you saw in the credits of a show or in a photo credit line in a newspaper/magazine, then went to their web site and bought something? That's right, probably never. Guess what - you're not alone. No one does that. The 'great exposure' I get from infringing use is completely useless to me. I only make meaningful revenue from usage license fees, which is exactly the thing every infringer steals from me when my image is used without permission and payment. It's no different than a shoplifter taking something from a store.
 One example showing the negligible effect of "exposure". This graph shows daily views on my Youtube channel's official El Reno tornado video during the time a large and popular multi-million subscriber Youtube channel showed the entire footage in one of their videos without permission or a license. The large channel received over 2 million views on their video, while my channel only received an extra 4,500 extra views and only a small handful of new subscribers above normal. If you're a media employee or personality, you of all people should know the true value of publicity and exposure for a photographer (that is, there is none). Some of you are on TV every day. Does that publicity pay your rent and buy groceries? No, then why do you think it would pay for mine? Would you stay at your job if your GM said "You know, since you're getting all this publicity from being on TV all the time, we aren't going to pay you any longer". Copy editors and writers, does that credit line pay your salary, or is it the company that employs you? The only benefit I get from use of my work is when I'm paid a license fee. The 'you'll benefit from the exposure' line is, at best, a myth by those who really don't think about what they're saying, and at worst a lie by the unscrupulous trying to take advantage of someone they think doesn't know any better. I gave you credit!Credit lines are meaningless. They do absolutely nothing. And they're not this magic wand that make all copyright considerations go away. It's an unfortunate myth that a credit line entitles someone to just take whatever they want.
A credit line is a professional courtesy for paid, licensed use - it is not required nor do I care whether or not I'm credited when my work is licensed. I only care that I get paid. Credits don't fill my gas tank, pay my rent, buy my groceries and pay for my equipment and operating costs: money does. When was the last time you saw a credit somewhere and did anything as a result? By that I mean something like visiting that person's web site, buying something from them, or doing anything at all that would benefit them even slightly? Right. Never. And guess what? You're not alone. No one does that. There was a recent thread on Twitter/X regarding a popular aggregator/compilation account (Massimo) stealing the best photos from hundreds of photographers, then justifying it by saying "I gave them credit!" (and that account is far from the only one, there are dozens). I asked his followers straight out if they followed the accounts of any of the photographers as a result of that credit. They all said "No, why would we? The aggregator account is where all of the great photos are. It's too much trouble to follow the photographers". They wouldn't even do as much as click "follow" for the photographers, much less anything more than that! And that's the reality of credit lines everywhere. They do nothing for the photographer. Credits also never have, and never will, factor in as a defense when a photographer pursues the infringement in a legal case. I'm non-profit/not making any money from your images or video.Even if you don't make any money on the video or photo, the platform that you're posting it to does in the form of advertising revenue. I covered that in my introduction at the top of this page. You are also causing me to lose viewers on my own web site or Youtube channel, which does cost me, even if you're not making any money. I also have to spend time sending DMCA takedowns and searching for infringing copies like yours.
There is also nothing stopping you from monetizing your social media following in the future. The growth you receive from posting my video now has a direct benefit to you if and when you ever choose to monetize your account. My use of your work was 'fair use'.Let's first establish this fact: the vast majority of those on Youtube and social media don't know what Fair Use actually is. I'll prove it to you: ask anyone claiming Fair Use to, without Googling it, name one of the four factors of Fair Use in the law. You'll never get a correct answer. They can't name even *one* of the four factors, much less all four of them - yet they'll be the ones coming at photographers like me, shouting things like "Hey! Ever hear of Fair Use?" Yes, and I know it well - do you? To these Youtubers and social media accounts, Fair Use just means "whatever I want to do", not anything remotely related to the actual law, because they've never even read the law once.
Just to ensure that everyone reading can see this at least once, this is what Fair Use actually is: 17 U.S. Code § 107 (source):
Almost everyone stops reading at the first sentence in the law, concluding that anything that is "criticism, comment, news reporting, teaching or scholarship" means that copyrighted works can be used without a license without restriction. Not only is that a patently absurd and unfair assumption, it's completely ignoring the main part of the law that comes next: the four factors. Every federal copyright infringement case was decided on the four factors alone (view actual case decisions here to see for yourself), not simply whether they were "transformative" or "criticism, comment, news reporting, teaching or scholarship". The four factors actually place narrow guardrails on "criticism, comment, news reporting, teaching or scholarship" that disqualify most of what you see being claimed as Fair Use on the internet today. Fair Use was intended to allow unlicensed use in a very specific and narrow set of circumstances. Much of today's Youtubers and social media account owners have no desire to do anything that Fair Use actually intended to allow, rather they are mostly either willfully ignoring the law, or trying to illegitimately shoehorn what they're doing into one of those narrow categories. It's all just to weasel out of getting permission or paying license fees for the same type of uses that have always been paid in the entire history of media and publication. There have only been a handful of borderline actual Fair Use cases involving my work that I have elected to not pursue or file takedowns for. If I had to give a figure, Fair Use might apply in something like 1 out of every 10,000 cases I discover. Fair Use is not based on this tunnel vision on "transformativeness, commentary and editing" that so many believe. Almost everything that has ever aired on television, media and in the movies has commentary and editing. Just think about this for a minute: news broadcasts do nothing but comment on footage from news cameras, and that has never been considered Fair Use, even though it is "news reporting". The four factors must be considered when evaluating a Fair Use claim - that includes things like "criticism, comment, news reporting, teaching or scholarship". Fair Use is supposed to be fair, not a free-for-all against the owners of the content. You can read this from the source at the U.S. Copyright Office. Here are those four factors and how they apply in the case of works created by photographers like me:
I like to ask this question to someone who is so liberal in their interpretation of Fair Use: What, to you, would *not* be Fair Use? Can you give an example of what you think would be copyright infringement? The answers to this are usually very revealing. Finally, the interpretation of Fair Use held by most "amateur copyright experts" doesn't exist in the professional world. Everything you see on television and in the movies has been licensed or has written permission obtained: *none* of it was taken and used under Fair Use. And those are multi-billion dollar corporations with the most powerful legal teams on the planet. If they could take things under Fair Use in the way most amateurs believe, they absolutely would, and they have more than enough legal firepower to defend themselves from copyright challenges. Why do you think a Youtuber can do what the entire media and entertainment industry doesn't do? If you're a Youtuber wanting to use third-party content, take that free legal hint from lawyers you and I could never afford: properly clear everything you use. Think about what the world of media and entertainment would be like if Fair Use was so permissive. There would be no professional photographers, writers or artists. The only video content that would be available for the big Youtubers and media corporations to use would be amateur America's Funniest Home Videos-style cell phone clips. You'll hear some respond to the above that "fair use is always subjective, is never black and white and each case can only be definitively be adjudicated in a court decision". This is only partially true, and ignores the practical reality: countless cases are filed by small-time creators all of the time, and most are obvious enough that they settle long before going to trial. Most competent attorneys (either representing creators or defending infringers) know the likely outcome of most cases should they ever end up in Federal court. That means the high cost of Federal litigation is not an obstacle to small-time creators pursuing a case that is obviously not fair use per the four factors, as I can personally attest. You're supposed to share on social media!Right. That's why there is a 'share' button for every social media platform out there. Sharing of most anything online is a simple one-click deal. Quick. Easy. Painless.
But the thieves don't do that. No, they go through the extra steps to download the image or video and repost a separate copy of it to their account! Answer this very simple question: why would someone do that instead if just clicking 'share' or 'retweet'? Why would they go through all of that extra trouble? It's because they know they're going to get all of the viral benefit instead of the photographer by doing that! I invite anyone to try and defend that - you can't. That's not sharing, that is stealing. "Sharing" is good, and all of the platforms have made it easy to do it. Stealing an image is never accidental - it requires additional, deliberate steps (right click, download, re-upload). As opposed to the simple one click of a legitimate share. Stealing diverts all of the viral traffic, likes, shares, retweets and links to the thief's account instead of the photographer's, causing their following to grow instead of the photographer's. And again, the little credit line or mention sometimes given in such cases doesn't do anything in reality. People will not click over to the photographer's account and/or search for me from the infringing post (I know and have the site traffic data to prove it!). They're just going to re-share or RT the thief's post without ever giving me a second thought. If they can see the photo on Twitter, why would they click over to my web site to see the same image again? This is especially true of mobile users (on phones or tablets). They'll see an image or video on their feed, and they are just going to engage (comment/like/share) THAT copy, then keep on scrolling. No one on a mobile device is going to click away from Facebook, Twitter or whatever app to try and find my original or go to my web site. It just doesn't happen! If that doesn't explain it enough, here's a more detailed post and infographic I put together on it. What's the big deal? It's just a Twitter/Facebook/Reddit/Imgur image or blog post!Half of the time, an infringing photo ends up ranking higher in search engines than my original copy. This is especially true of TV station sites and media blogs. Sites like Twitter, Facebook and Reddit all have very high rankings in search engines, which means a copy of my photo on those sites will almost always outrank my copy here on this site. That means when someone searches for the image in Google/Bing/Yahoo/whatever, the infringing copy sometimes shows up first - then that link gets re-shared, boosting the infringing copy even more.
Furthermore, a competing copy on social media takes engagement (likes, shares, comments, favorites, retweets, new followers) away from my account and diverts it to the thief's. Their copy could go viral in the future, and leave me with nothing. Again, people are generally not inclined to go searching for the original copy of an image, they'll just do what is easiest and re-share the first one they see. I already covered that above. Copying something doesn't cost anything, so you lost nothing when I copied your photo.Really? I mean come on now. You don't need to look much farther than this argument to see that anti-copyright activists don't think about what they're saying. I don't know if you've noticed, but the word copy is the first part of the word copyright. The word literally means "the right to copy", copy is half of the word. Copying is the reason the law, and the word itself, exists. Copyright was conceived of in the early 1700s to address the harm done by unauthorized copying of books in the era of the first printing presses.
As I've described in detail already, my primary income from photography and video comes from selling copies of my work to be used by third parties. Most of a musician's income comes from selling copies of a song or album. A copy does have value, it is the cornerstone of how artists, photographers and content creators make a living. Society has understood this for the past 300 years - why don't you? If you can't make money from your work because people steal it, then find another job.This is like telling a store owner that if he can't make money because of shoplifters, then he should find another career instead of doing loss prevention and prosecuting the thieves. It's interesting that those who say this are acknowledging that the work is desirable enough to steal and use for their benefit and profit, but somehow not worth paying me for so I can make a living. It's a double standard.
If you don't want people stealing your work, don't post it online.And you think that is a viable business strategy - why, exactly? Take my primary business product off of the very medium that generates my income? Sure, great idea. To borrow from the previous entry, that's like telling the store owner that has a problem with shoplifters to just stop advertising and just keep his doors locked. If no one knows about his store and no one can get in, he won't have any shoplifters, right? Yes, but he also won't have any customers either.
Sometimes I don't know if these type of objections are real or just the work of a provocateur. They're so self-evidently absurd that just a few seconds of critical thinking should keep them from being levied. You're just jealous of a bigger account getting more views.This person is saying I'm "jealous" for a bigger account getting more views on a stolen copy of my own video than I am getting on my original - views taken directly from those originals. I mean, what can you say in response to someone like this? I guess to this guy, a person who had their car stolen is "just jealous" of the thief that is driving it now.
A lot of the people posting your videos are just kids.While that may be true in some cases, it doesn't change the fact that it is still a stolen video/photo, and that it has the same devastating financial impact on me as any other reuploaded copy when it goes viral. There have been countless examples of kids reposting dozens of chasers' best videos and getting millions of views on them. There really is no difference in the impact those have, no matter whether it is a kid or an organized crime group.
I have never filed a lawsuit against a child, nor do I plan to. But I have to send takedowns for all stolen videos, regardless of who posts them. And what if that "kid" is actually an adult, or has a monetized channel in his or her parents' names? We have also seen countless organized piracy channels misrepresent themselves as innocent victims (kids, a poor family in a third-world country, etc) all of the time, because they know they can attempt to deflect consequences or even send an angry mob against someone sending a takedown while they make tens of thousdands of dollars a month on our videos. As I explained above, a copyright strike on most platforms expires after 90 days. A channel only gets taken down after getting 3 strikes. A single strike should be a fair consequence and warning to any account or channel owner that they are doing something wrong, kid or not. A true artist doesn't worry about money, only that his work is appreciated by others.The person making this statement is really saying that there should be no such thing as a professional artist, photographer, writer or any type of content creator. When they say 'no, I'm not saying that', my next question then is how does the professional content creator make a living? The answer is usually along the lines of 'he should freely give and let the money situation work itself out'.
"Be passionate about your work, and the money will follow" is a utopian fantasy that does not work in the real world. I know it because like many photographers, I did just that back when I was starting out. It would be nice if I could freely give everything away, then have all of my needs just magically taken care of as a result. I always ask someone who says that if they could suggest a scenario or plan on where all this magical money is going to come from. So far, I've never received an answer. Copyright should expire earlier/not exist because free creative works would enrich society.I'm sure society would benefit if Wal-Mart gave away all of their products for free, carpenters and plumbers gave their services away for free, and Dairy Queen gave away free ice cream cones. That sure would enrich a lot of people's lives! That is, until all of those companies and people went out of business because they weren't bringing in revenue. Then there would be nobody making free stuff to give away.
If you believe that free creative works are so essential, so vital to an enriched society - then why don't you do something to help out the content creators that are producing them? Why is that burden on us 100 percent? We have to pay full price for all of our costs of producing content - cameras, travel, etc. And you can't see fit to pay us anything? You call us 'evil' for expecting to get paid and protecting our copyright? This absolutely boggles my mind that so many people think this way, and I have yet to hear a rational basis for it. Copyright prevents creative expression.Anti-copyright activists care infinitely about "creative expression" in using others' works without paying for them, but zero about the creative expression of the person producing the original material. They feel the former should have unlimited profit potential, while the latter has to settle for some arbitrary limit on their income.
In practice, this means I'm only entitled to a pittance from a video that took me three 24-hour days of work during a winter storm, while they can slap their face on a copy of a video with "commentary" like "wow bro, look at this!", upload it to their Facebook/Tiktok page, make five figures competing with me for viewers and call it all "creative expression". You could make money from your photos and videos in other ways.Anti-copyright activists believe there are all of these mythically-lucrative secondary and tertiary income sources that creators could use to earn a living if all of their primary income (licensing and online ad revenue) was taken away. These include things like merch, sponsorships and donations.
Most of those secondary income streams (particularly merch and donations) are very small compared to the primary streams, unless you're a popular personality. I'm a behind-the-scenes cameraman, which has meant that my social media presences have not performed like my Youtube channel has. I have dabbled in merch sales a few times with products bearing my photos, of which I made absolutely *zero* sales. I'm not comfortable with asking for donations. I feel that it's online begging, and even if it wasn't, I don't produce viral videos at the consistency that donors would expect in return. Occasionally I'll go 8 to 12 months or more without a "big catch", that's just the nature of dealing with the weather. Would donors stay with me through times like that? Very unlikely. Getting sponsorships takes a lot of legwork I don't have time for, and is another thing made problematic with my variability/unpredictability in video publishing. This idea is just another manifestation of the double standard of pirates, infringers and anti-copyright activitsts: they are happy to have their primary income from online ad views from my videos, but expect me to give that up and scrape a living together via these other unproven and unknown means. "What if I can't do that?", I've asked them. "Not our problem, you figure it out", they always reply: yes, that's perfectly on-brand for the type of people that act and advocate that way. I gave you lots of compliments!I genuinely appreciate that, but it doesn't make stealing my work OK.
Content on the internet should be free!If that's true, then so should my cameras, fuel, hotels, groceries, health care, rent, internet access, utilities, insurance, you name it. Figure out a way for me to drive thousands of miles a year, take weeks of unpaid time off of work, buy and maintain professional gear, keep gas in my car and take care of my living expenses for free while I capture my images and video, and I'll give a free license to use my work. Deal?
Content theft is just the way it is on the internet today. You can't do anything about it. You just need to accept it and get over it.I can assure you it's not the way it is, unless you are reading a different copyright law than what is currently in force. And photographers absolutely can do something about it: the many infringers who have found themselves on the receiving end of (very deserved) strikes, terminated channels/accounts and lawsuits would also disagree with your statement.
As I've already explained multiple times, this is an issue of pragmatics that determines the very existence of my operation. "Just getting over it" would be the end of my career. It's really that simple. You're just worried about money.I don't understand what is meant by that. Of course I'm concerned about money, because I have groceries, health care, rent, internet access, utilities, insurance, car payment to pay every month just like you do, on top of the costs of producing my content!
Just take a quick browse around my site and Youtube channel: it takes money to produce all of that. Not exposure, not credit lines, not likes on social media. More than 90 percent of what I've captured would not have been possible without license fees and ad revenue I earn from my content. And think about how much more I'd have been able to produce if it weren't for the huge amount of funds siphoned away from me by copyright infringers, preventing me from doing this full-time! You're an evil capitalist for wanting to earn money from your video/enforce your copyright.So the small-time photographer that bears all of the costs, risks & workload to capture valuable content is evil for wanting to be paid to cover his rent and groceries, but the multi-million dollar Youtuber or corporation getting rich from *using* the content without paying is perfectly virtuous. Way to stand up for the worker there, comrade.
You sure do complain about this a lot.As would you if the majority of your paycheck (after taxes!) was stolen every year.
You sound really negative and bitter.How do you expect me to feel about a lifetime of income being ripped away from me, having to quit the business I spent 22 years building and then on top of that, being labeled as the bad guy for objecting to all of this or doing anything to fight back against it?
Calling the unauthorized reuploading of videos a crime is hyperbolic.Federal law, specifically 17 U.S.C. 506(a), states:
A multi-million view stolen video can easily earn both the platform and the uploader well into five figures illegitimately. In fact, much of the organized piracy operations, of which the social media platforms thenselves are party to, profit from and and run interference for, qualifies for RICO charges should the US Department of Justice ever choose to pursue them. I'm not sure what else you would call systematic, deliberate, illegal diversions of income, reaching 7-figures at that, from an individual. You are a copyright troll.So, given everything I've just finished describing in great detail, exactly what do you think I should do in response? Please email me and explain what you feel I should do. I'm serious. I would like to hear your proposed solution to this problem.
Every time I've posed that question to someone who thinks I'm doing anything wrong, I get no answer. So maybe if you're one who holds that opinion, you can make history by giving me another workable pathway to fixing this problem that you think would be better. My inbox is always open. I think I know the reason why I never get an answer to that question. It's because in every person's mind who uses the "copyright troll" pejorative, they think a photographer should do nothing about theft of his or her work. They're just afraid or unwilling to because of how absurd it would sound to actually say that out loud. The reality is, if any of these people (or their companies, friends or relatives) suffered even a fraction of the losses I have, they'd be on the phone with an attorney in five seconds, and everyone would be supportive of them. It's absolutely mind-boggling that these people place me in some other category that makes me the bad guy if I do anything to fight back. Every action I take is completely justified and in accordance with the law. And I haven't made, nor do I ever expect to make back all or even a majority of the losses I've suffered. I've always found this accusation like something you'd hear from a cartel. It's like a small mom and pop business being told "you're going to let us take as much of your inventory as we want, and you're going to be happy about it. And if you complain or fight back, we'll ruin your reputation". Infringers and their defenders say and do the exact same thing to me. A media outlet or streamer showing your storm video helps public safety/awareness, and should be free.It's true that storm chaser video can be informative and help with public awareness during severe weather. But that doesn't change the fact that a.) chasers still have operating costs and bills to pay and b.) the media outlet or streamer is still earning large amounts of money on their storm coverage, either directly (ad revenue) or indirectly (viewership gained for non-storm-related programming).
If you hold that chaser video of storms is so valuable, why are you against the chaser being compensated for that value? You don't have a problem with the TV station, network, Youtube channel or streamer earning income to cover their costs and pay their salaries, but you're somehow against that for the chaser. Chasers are deemed a vital part of this process, yet for some reason we're the only ones who have to donate all of our efforts and operating costs. It's true that some TV stations suspend advertising during "wall to wall" coverage and don't earn direct revenue during that time. But let's be real: most infringements aren't a part of wall-to-wall coverage events at all. Even when one is, everyone in the studio - even the janitors - are still getting a regular paycheck that ensures they can even be there to do all of that in the first place. Chasers receive no such support unless they fight and push for it, and when we do, we're the ones accused of being "all about the money". Stations spend lavishley on personnel and equipment for storm coverage (helicopters, live trucks, computers, etc) yet many conveniently leave chasers out of that budget, even though the chaser's contributions are often some of the most prominent and important aspects of that coverage. All of that is beside the point that most of the alleged "public safety" intent claims of someone using a chaser's video are dubious. Most don't even have any connection to actual media coverage of storms. Just watch any incidents of this to judge for yourself whether it was really done "in the name of public safety". Even the pirate channels pull this scam, reuploading videos of the storm after it is over and claiming it's all for public awareness. It's another manipulative card that infringers play to make them sound noble insted of criminal, and unfortunately many viewers and followers believe it. The audiences on the stolen copies of your video don't overlap with yours, so they aren't a big loss.AMC paid to produce the hit TV series Breaking Bad. Could HBO, NBC, Showtime and other channels just take the show and air it, then say "our audiences are different, so it's all OK"? Of course not. AMC produced the show so that viewers would come and watch their channel instead of the competition's. Online videos are no different. I put the huge effort in time, money and "sweat of the brow" to produce my content so viewers will come to my channels to watch it. That's the only way I receive any benefit from what I do.
Every online viewer is easily capable of coming to Youtube to watch my originals. Even the most committed Facebook, Tiktok and Twitter users all spend at least some time on Youtube. Youtube is even installed on smart TVs! Someone watching a stolen copy of my video on those platforms means they'll never watch it on Youtube on my official channel. It is a demonstratable loss any way you look at it. The importance of where viewers watch content is a basic and foundational principle in the world of media, and that principle doesn't change on the interenet. You should just heavily watermark your photos and videos.This is a common suggestion by those wanting to help me (thank you by the way, I do very much appreciate that). You'll notice that television, movie and streaming services don't watermark their content (beyond the little logo in the bottom corner like I do). This is because it detracts from the viewing experience. No one likes watching videos with huge or distracting watermarks, and videos with them do not perform well.
I've tried various types of watermarking schemes over the years. The more subtle ones don't do anything to discourage theft and they don't result in any viewers coming over to my channel (see my section on credit lines above). Static watermarks can easily be blurred, covered or just removed altogether with software. The only watermarks that are even partially effective at discouraging theft have to be so ostentatious and distracting (like ones that move around and change size) that they seriously affect the viewing experience and resulting performance of the content. There are other professional chasers still operating and even thriving, why can't you do it too?All professional chasers are dealing with the piracy and infringement issue (see the links at the end of this article), but some are able to survive in spite of it. I can't speak for any of them, but in my experience, there are various possible reasons that can explain it.
First of all, you'll notice that most full-time chasers today are still relatively young (under 40 years old). I don't know what their personal life choices are that result in them being able to continue. It could be that some are making huge sacrifices to pursue their passions, like living out of their cars to avoid paying rent or utilities or not making any contributions to a 401k or their savings. At least for me, I know that's what I'd need to do to keep operating. It's easier to do things like that when you are young and especially if you don't have a family to support. When you get married and/or retirement starts looming in a decade or two, you realize you need to start taking care of those things. Others are independently wealthy, without any need to worry about what revenue is coming in. Some pro chasers are wildly successful enough to survive despite all of the piracy, just like big movie studios and pop music stars do. I'm not a "superstar" pulling in numbers like that which would allow me to survive despite 95% of my income being taken away. There are some revenue sources, like live streaming and social media popularity, that are only a good fit for a certain type of personality. I have never been able to duplicate the success of my Youtube channel on social media, where my followings have always grown very slowly. My view rates on social media aren't enough to reach those platforms' monetization thresholds, which would mean that most of my viral view revenue would go to the platforms instead of me. That's another twist of the knife from platforms like Facebook, they're fine to allow pirates to profit from my videos, but they've made it impossible for me to. I've always been put off by the idea of live streaming, where I would have countless people watching my every move all day. Live streaming is also very difficult to do chasing solo: The few times I tried it, it pushed me over the limit into task saturation, making me miss shots and/or just feeling dangerous to drive at the same time. To put it simply, I'm a behind-the-scenes guy without a charismatic personality, which takes me out of the running for a lot of those other income sources. Couldn't you start monetized accounts on Facebook/Tiktok/etc?Not really. As I mentioned in my previous entry, since I'm a rather boring "behind the scenes" personality, my social media followings grow very slowly and it would take me a long time to reach the required follower/watchtime thresholds on those platforms. My Twitter/X account only has 2,200 followers, and I've had it since 2009! That means that 100% of the revenue from any viral videos I post would be taken by the platforms themselves - it would be like giving them a blank check until I met their arbitrary thresholds. Not to mention, an official non-monetized video on those platforms would compete for viewers with my Youtube originals, just like all of the stolen copies do.
The bigger issue is that most of those same platforms have been a part of the million-dollar diversion of my income for many years, and I'm part of ongoing legal action against them for it. It's not a good idea to go and start posting my videos to those platforms voluntarily while all that is in progress. It's also a matter of principle: I'm not willing to do business with any company that has already knowingly and directly contributed to such huge financial losses. Until that is made right, you won't see me posting anything of value on any of those platforms. Does this mean you are going to quit storm chasing altogether?No, I'll always enjoy storms and will chase whenever I can. What I had to quit was the professional cameraman side of chasing, which in practical terms means scaling back to being a "hobbyist" chaser. If you remember at my extensive chase logs section, you know how much I covered and how many miles I put in each year. The vast majority of that was enabled by the revenue that it was generating, allowing me to prioritize it just like any other job. I'm now transitioning my effort into building my I.T. career, which requires things like studying for certifications and giving up the low-paying, flexible I.T. jobs I've had for most of my life (that were required to be able to take days off on short notice for the weather).
This change also means I'll not be able to upgrade to the latest cameras and take multi-day expeditions, other than maybe a single weeklong Plains chase in the spring. It also means the end of most winter weather expeditions, which were the most difficult and dangerous and are no longer worth the risk, expense, the 24-hour days and rarely having a day off in the winter. The cameraman job was a grind, one I'd still be willing to do if the fruits of it would be coming to me instead of pirates and Big Tech oligarchs. I am involved in legal cases against infringers and the platforms that may result in some of that lost income being recovered. Depending on how all of that goes, I may be able to make a return - but those cases take years to resolve, and may not be successful. I just can't count on them. How can I help?I know I have many viewers and supporters who understand what I've been going through. I am very thankful for all of you. I'm often asked what kind of help I could use in this battle. These are the most effective things you can do not only for me, but any creator you follow and want to support:
Creator testimonies of the impact of infringementCopyright Alliance spotlight on chaser Hank Schyma - Accomplished chaser and musician "Pecos Hank" of Youtube fame has lost over a billion views to infringing reuploads of his videos. Hank suffers from the same type of infringements I do, but to an even greater, incomprehensible degree.
Copyright Alliance spotlight on chaser Brandon Clement - Brandon is a colleague of mine who chases full time and also suffers the same type of infringement problems on a massive scale. Brandon has been at the forefront of exposing some of the difficult-to-believe organized criminal operations affecting our industry. Destin Sandlin of Smarter Every Day on video freebooting - Destin's wildly successful channel Smarter Every Day has also been impacted by the phenomenon if pirates and reuploaders copying his videos to social media platforms. LegalEagle on pirate channels - Another good video from a popular channel detailing some of the obstructive tactics that platforms use to make it exceedingly difficult for a creator to take down pirate channels and uploads.
LinksIf any of what I said above is news to you, I implore you to read up on the basics of copyright. It might save yourself or your company significant trouble in the future. Here are some helpful links:
US Copyright Office - Contains a wealth of great information straight from the source.
Fair Use Index - A great resource on Fair Use from the Copyright Office, including a repository of real-world court case decisions. Five Myths about Copyright from the University of Texas. Reasons why pro photographers can't work for free Sharing on Social Media vs Stealing - What constitutes a 'share' on social media versus infringement. Plagiarism Today - News and information about current copyright cases and issues. For photographers and creators: dealing with copyright infringementIf you are a photographer, writer, artist or any other type of content creator experiencing what I've described in this article, I wanted to pass along advice that has helped me in the fight against infringement:
About Dan
|