Quality Index (QI) for storm chasing events (in development, current version v6)
|
My work is, at this very moment you are reading this, generating the most income it ever has in my career. Yet, I was forced to shut down the professional side of my successul operation, against my will, due to one cause alone: 95% of that revenue is being stolen by piracy and copyright infringement. I've lost more than $1 million to copyright infringement in the last 15 years, and it's finally brought an end to my professional storm chasing operation. Do not be misled by the lies of infringers, anti-copyright activists and organized piracy cartels. This page is a detailed, evidenced account of my battle I had to undertake to just barely stay in business, and eventually could not overcome. It's a problem faced by all of my colleagues and most other creators in the field. |
The QI or Quality Index is a proposed method to quantify the overall quality of a storm chasing event using objective criteria. The term "quality" itself is subjective, but we will define and use the following factors to determine the final QI: daytime photogenic tornadoes, storm structure, lightning, terrain, road network, forecast lead time, storm impacts, rare features and human impacts.
The following is a screen capture of the most recent application (v6) of the QI-S formula to a selection of storm chase days. QI-S of 10 and up is "good", 20 and up is "exceptional": |

The "QI-S Base" is the calculated value before considering negative human impact metrics (what the QI-S would have been if the tornadoes had not hit anything).
QI: Definitions & metrics
- Standard observer positions: The most common storm-viewing positions employed by storm chasers, mainly from south, east and north of a mesocyclone. Distance from the storm is not a factor considered by the QI.
- Primary targets (PT): Traditionally-evident targets where the majority of storm chasers ended up. PTs include but are not limited to dryline bulges, warm fronts, triple points, outflow boundaries, boundary intersections, upper-level speed maxima, etc. There can be multiple primary targets in a single event (common, for example, during big outbreaks).
- Secondary targets (ST): Non-traditional target areas such as cold-core, DVCZ, upslope or Midwest warm/stationary front storms where only a small percentage of storm chasers deliberately target. Note that these types of targets can become primary if the traditional target areas are too marginal or not present. Secondary targets that become primary should be counted as PTs in QI calculations.
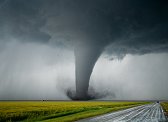
- Daytime photogenic tornado (DPT): The number of daytime tornadoes with complete structure consisting of a funnel and/or debris spanning at least 75% of the distance from ground to cloud base, clearly visible to observers at least 180 degrees surrounding the tornado (standard observer positions). Photogenic tornadoes assume good visibility to all storm chasers in the vicinity (distance from the tornado is not considered by the QI).
|

ABOVE: Examples of daytime photogenic tornadoes. Low contrast does not disqualify a tornado from being considered "photogenic" if the low contrast is due to viewing from great distances and not from heavy precipitation surrounding the tornado.
- Standard tornadoes (T): The total number of tornadoes visible from standard observer positions during a chase in one target area - including photogenic tornadoes, tornadoes at night, or low-contrast rain-wrapped tornadoes (as long as at least one edge of the condensation funnel and/or debris cloud can be discerned visually and on photos and videos).
- HP tornadoes (HT): The number of tornadoes only visible from within the notch of a high-precipitation supercell. (Tornadoes counted as HTs should not be counted in the T total)
- Good structure (S): Well-developed and symmetric supercell structure, including high-contrast striations, banding and inflow tails.
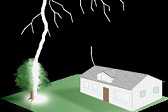
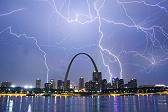
- Good lightning (L): Frequent, dramatic, remarkable and/or otherwise photogenic lightning accompanying the storm for at least 30 minutes.
- Terrain factor (TF):
- Good: Flat terrain with few trees or hills (example: western Kansas)
- Fair: Mostly-flat terrain with a few hills and viewing obstacles (example: eastern Kansas)
- Poor: Terrain with mostly trees and/or hills, few clear views (example: eastern Oklahoma)
- Roads factor (RF):
- Good: 1 or 2-mile grid, average spacing between paved or gravel secondaries no more than 4 miles
- Fair: No grid with half or more of secondaries paved or gravel. Average distances between paved/gravel roads between 4 and 6 miles.
- Poor: Few secondary roads, most secondaries dirt. No grid with average spacing between paved/gravel routes of more than 7 miles.
- Forecast lead time (FL): Forecast lead time refers to the ability of storm chasers to see the event coming in enough time to make a decision to travel to the target. "Tornado potential" refers to at least a 5% SPC tornado risk or equivalent level of confidence.
- Evening before & prior: Tornado potential evident before and up to 00z model runs the previous day
- Morning-of: Tornado potential only evident in morning data (day of the event).
- None: No clear tornado/supercell potential evident (mesoscale accident).
- Rare features (R):
- Multiple simultaneous tornadoes
- Sunlit tornadoes
- Audible roar
- High-contrast mammatus covering at least 1/4 of the sky
- Prolific upward lightning from towers and/or wind turbines
- Historic (H): Tornadoes/supercells that broke records or were otherwise exceptionally rare in their strength, number or configuration. NOTE: tornadoes that caused major disasters should not be counted as historic at the same time (the "major disaster" metric covers this aspect of historical significance).
- Negatives (N):
- Problematic traffic (TRF): Traffic (from storm chasers, locals or both) interfered with more than 10% of the chase in terms of slow travel speeds, delays at intersections and most available pull-offs occupied.
- Damage (D): Tornadoes that produced significant damage to homes.
- Human impact: tornadoes that caused injuries (I) OR fatalities (FT).
- Major disaster (MD): tornadoes that caused destruction to more than 1/3 of a town, more than 30 homes and/or 10 or more deaths.
Target-Level Quality Index (QI-S)
The Target-Level Quality Index or QI-S considers the quality of a single day target, either primary or secondary. The QI-S evaluates the best possible outcome of a reasonable chase involving one or more storms within reach of that target. The QI-S can cover multiple storms if all of them were observed by the majority of storm chasers in the target (example: May 5, 2007 involved tornadoes on 3 different storms in one central Kansas target).
The proposed formula (current v6) is as follows:
QI-S = ((DPT*300)+(FL*100)+(H*500)+(TF*50)+(RF*100)+(R*100)+(TRF*-100)+(D*-150)+(I*-350)+(FT*-500)+(MD*-1200)+(L*100)+(T*150)+(HT*70)+(DPTmins*1.1)*(60-speed)+(Smins/30)*(60-speed))/100
QI-S Calculator: Enter the values for each metric for a target (green column) to calculate the final QI-S for an event. The factors and multipliers are shown in the blue column at right - you can edit these to see how they affect the final QI.
Event-Level Quality Index (QI-E)
The Event-Level Quality Index or QI-E is the average of the QI-S for all primary targets. If secondary targets are present, the QI-E is the weighted mean of the primary targets average QI-S (weighted at 75%) and the secondary targets average QI-S (weighted at 25%).
Seasonal or Monthly Quality Index (QI-Y or QI-M)
Seasonal or yearly QIs are simply calculated as the sum of QI-E for all dates in the period. The larger the QI-Y or QI-M, the better the season, month or other defined period.
Spreadsheet formula
You can download an OpenOffice Calc spreadsheet file containing the formula here:
quality-storms-v6.ods
The formula in spreadsheet form is as follows:
OpenOffice Calc:
=ROUND((((C2*300)+(J2*100)+(K2*100)+(L2*100)+(M2*100)+(N2*100)+(O2*100)+(W2*100)+(X2*100)+(U2*100)+(V2*500)+(P2*-100)+(Q2*-150)+(R2*-350)+(S2*-500)+(T2*-1200)+(D2*100)+(H2*150)+(I2*5)+(E2*1.1)*(60-G2)+(F2/30)*(60-G2))/100))
Excel:
=ROUND((((C2*300)+(J2*100)+(K2*100)+(L2*100)+(M2*100)+(N2*100)+(O2*100)+(W2*100)+(X2*100)+(U2*100)+(V2*500)+(P2*-100)+(Q2*-150)+(R2*-350)+(S2*-500)+(T2*-1200)+(D2*100)+(H2*150)+(I2*5)+(E2*1.1)*(60-G2)+(F2/30)*(60-G2))/100), 0) Feedback and Discussion
| View 1,599 storm chases: |
| by year: |
|
| by type: |
|
|
|
|
My work is, at this very moment you are reading this, generating the most income it ever has in my career. Yet, I was forced to shut down the professional side of my successul operation, against my will, due to one cause alone: 95% of that revenue is being stolen by piracy and copyright infringement. I've lost more than $1 million to copyright infringement in the last 15 years, and it's finally brought an end to my professional storm chasing operation. Do not be misled by the lies of infringers, anti-copyright activists and organized piracy cartels. This page is a detailed, evidenced account of my battle I had to undertake to just barely stay in business, and eventually could not overcome. It's a problem faced by all of my colleagues and most other creators in the field. |
GO: Home | Storm Chase Logs | Photography | Extreme Weather Library | Stock Footage | Blog
Featured Weather Library Article:
|
|