|
Home | Blog Index | Blog Archives | Christianity & Faith Essays | Storm Chasing Essays
Using 850mb charts to forecast snow (and a primer on atmospheric layers)
 During the winter, you will hear me talk about 850mb charts and model forecasts. During storm chasing setups, I'll talk about 700mb and 500mb conditions. I decided I'd write an article to introduce you to these layers of the atmopshere and why they are important to forecasting. During the winter, you will hear me talk about 850mb charts and model forecasts. During storm chasing setups, I'll talk about 700mb and 500mb conditions. I decided I'd write an article to introduce you to these layers of the atmopshere and why they are important to forecasting.
The atmosphere is made up of distinct layers, varying in thickness and number from day to day and season to season. Each layer has its own properties - wind speed, direction, humidity and temperature. If a layer is saturated (at or near 100% humidity), condensation occurs - and viola, clouds form. If you've ever taken a flight in a jetliner, you see these layers pretty clearly. At takeoff, you'll start out in clear air - the first layer (or layers). Then as you climb, you'll pass through clouds - another layer. Then another clear layer, then another cloud layer - and so on. Sometimes you'll see three or more distinct cloud layers sandwiched between clear ones - some thick, some very thin.
We live down in the layer at the surface (called the boundary layer, since fronts are usually confined to it), so it's the one that we most associate with our weather. However, what goes on in the layers aloft also play roles in determining what type of weather we see at the surface. As a result, meteorologists need to analyze all of the layers in the atmosphere to make their forecasts.
In meteorology, the atmospheric layers are measured by and referred to by their barometric pressure readings (in millibars, abbreviated mb) and not their actual distance above the ground. That can seem a little confusing at first, especially since the millibar levels are almost never at the same physical altitudes from day to day. This is what you'll see me talking about when I refer to the 500mb layer, the 850mb layer, etc. The higher in the atmosphere you go, the lower the pressure reading. 850mb refers to the layer above the surface boundary layer, usually a few thousand feet high. 700mb is another few thousand feet above that, 500mb is the 'midlevel', and the 300mb-200mb layers are the topmost in the troposphere. The surface layer can range from 1000mb-950mb or less depending on terrain elevation. In mountainous areas, sometimes the ground is even above the 850mb layer! In the winter, the layers are more 'compressed', not as thick - while in the summer, the thicknesses are greater.
Soundings: measuring upper air layers
At the surface, there are hundreds of weather stations in the USA reporting dewpoint, temperature, wind speed & direction and barometric pressure (you can see these on the METAR display). But that data only tells us what is happening at the surface - how do we measure the upper air layers? This is where weather balloons come in. Twice a day, weather balloons are launched from over 1000 sites around the world (90 of which are in the USA). The balloons rise up through all of the layers in the atmosphere, just like you do when you fly on a jet. The balloon carries an instrument pack that measures the temperature, dewpoint, barometric pressure and wind speed/direction as it rises. This measurement is called a sounding, and the data is plotted on a graph called a skew-t:
Skew-T for a Pittsburgh, PA sounding
Soundings and skew-ts are a complex subject in themselves, so I won't go into too much detail here. However, just looking at the graphic above you can see the millibar levels in blue on the left, the temperature plot in red, the dewpoint plot in green, and the wind speed and direction readings on the right. The circular graph at the top is the hodograph, which is used to illustrate the directional wind shear profile. Where the green and red lines get close together (where the temp and dewpoint values are close), this marks layers that are at or near saturation - and therefore where clouds are most likely to be. This skew-t shows that there are probably clouds over Pittsburgh around the 800mb level. Just looking at this graphic, you can see how much that the conditions vary as you go upward in the atmosphere. The wind speed and direction, temperature and dewpoints vary greatly from what we see and feel down here at the surface.
850mb in forecasting winter weather
So what does the 850mb level have to do with snow? In the winter, you have to look at the layers from the surface up to around 700mb to determine the type of precip you will get at the surface - the most important of these usually being the 850mb layer. If 850mb and higher are below freezing, snow can develop and begin falling through the boundary layer. If the surface (boundary layer) is above freezing and 850mb is below freezing, snow will usually melt before it reaches the ground (as rain), or if it makes it to the ground will melt quickly. If the boundary layer is also below freezing, the snow can make it to the ground and stick. In many cases, falling precip will bring some of the 850mb temps down to the boundary layer, causing it to cool. So even if the surface is above freezing, heavy snow falling from a very cold 850mb layer can cool the boundary layer below freezing in a relatively short time. It's almost like dropping trillions of little ice cubes down into a huge cooler.
Conversely, if 850mb is above freezing and the boundary layer is below freezing, liquid raindrops falling into the boundary layer (or partially melted snowflakes) will either freeze into ice pellets before reaching the ground (sleet) or will freeze on contact with the ground (freezing rain).
One of the times that 850mb forecasts are helpful is when winter transitions to spring. Most springs, I attempt to forecast when we can say that winter weather is truly over for the season. The main resource I use to try and accomplish that is the 850mb temperature forecasts on the various models. It's pretty safe to say that below-freezing air coming down from Canada in the boundary layer (surface) is very unlikely by late March. This is because the spring sun angle tends to heat the boundary layer air before it can make it very far south. However, sub-32°F air can and often does make it down to the middle latitudes of the USA at the 850mb level and higher, sometimes as late as early May! Solar heating doesn't have as much influence at 850mb and above, so cold air at those levels can travel pretty far south even in mid-spring.
So, if 850mb temps are below freezing in April and May, does that mean it's going to snow? Maybe, maybe not - it depends. The influence of solar surface heating (called insolation) is increasing dramatically through the springtime, which usually keeps the boundary layer warm enough to prevent temps from dropping much in response to precip or mixing from a cold 850mb layer. However, it is possible for snow to reach the ground and even stick if the right factors come together. If the cold air at 850mb is persistent for several days, and if sunlight is limited by overcast skies, then the cold can mix down from 850mb - particularly if precip is falling. Also, if skies clear out at night and allow radiational cooling to cause temps at the surface to plummet, a cold 850mb layer moving in immediately afterward will have an easier time getting snow to the ground. This type of thing gets more rare the farther we get into spring - but it can still happen.
In the mountains and at higher elevations, the ground is closer to (and sometimes above) the 850mb level, so any frozen precip doesn't have as far to fall before reaching the ground. Some of the high ridgetops in West Virginia - such as at Snowshoe - can sometimes actually be in the 850mb layer. The boundary layer is also not as thick in the higher terrain, meaning a cold 850mb layer above it doesn't have as much work to do to get it to cool. As a result, snow is more common in the mountains during the winter, and is more likely during early to mid spring than at the lower elevations.
Exercise
So let's look at an example of using the 850mb chart to forecast snow in the Appalachian mountains of West Virginia. I like the UCAR model outputs best for this, as they have a nice superimposition of the 850mb temp and humidity parameters. This makes it simple to see where 850mb dips below freezing and where the layer is at or near saturation (more likely to be producing precipitation). When 850s dip below 0°C and are close to 100% humidity, that is a signal for snow. Let's look at this NAM model forecast for a November 2009 possible snow event:
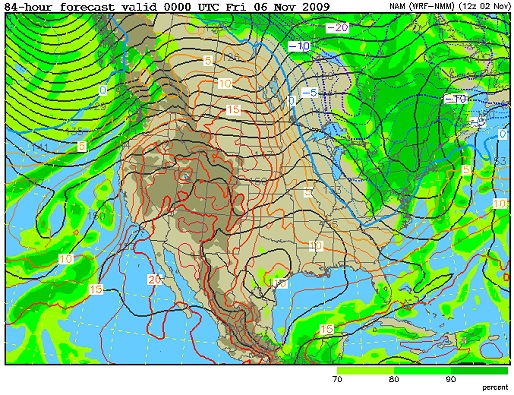
NAM 850mb chart
This is a typical Appalachian upslope pattern (detailed explanation here), with an upper trough swinging through and driving cold winds on its trailing side into the mountains. Remember, upslope winds have a cooling and moistening effect - encouraging saturation and precip formation at 850mb (given enough ambient moisture). This is why the humidity parameter above extends 850mb near-saturation values far to the south along the mountains.
Again, while the 850mb charts are the first thing I look at, there is more to the story. Any snow at that level can't do much if it doesn't make it to the ground. So we need to look at the surface temps.
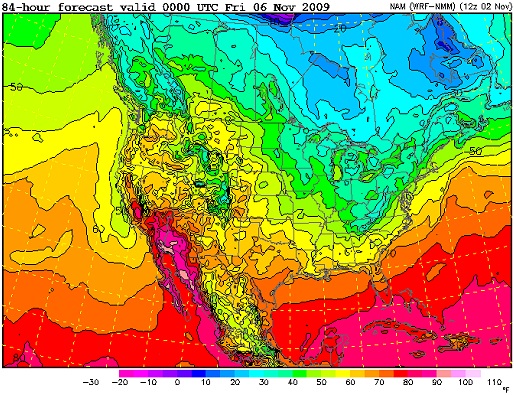
NAM surface temps
The NAM has the 35°F isotherm (line) at around 2500 feet there at 7PM. Looking at another model, the GFS, shows nearly the same thing - this is what we call 'agreement' in two or more different models:
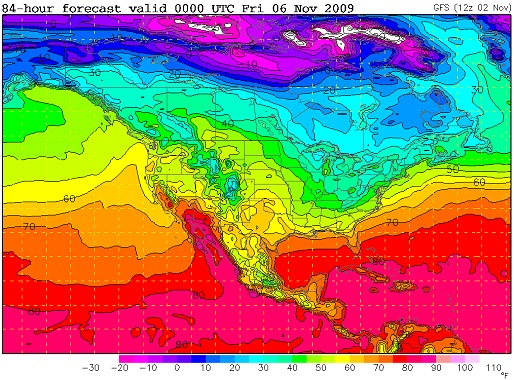
GFS surface temps
Now, the NAM model I'm using here only goes out to 84 hours. Looking at the next frame on the GFS (which goes out much farther) for the next morning shows below-freezing temps areawide (the 30°F isotherm is encircling the entire state of West Virginia):
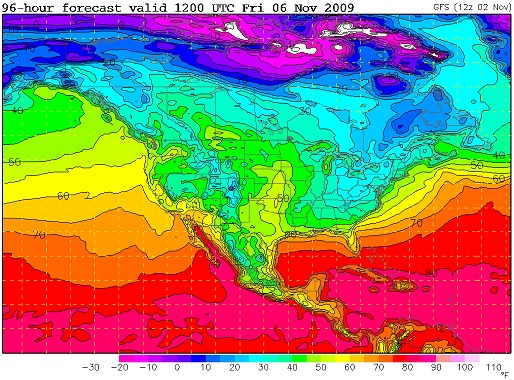
GFS surface temps
Both models show precip across WV on that Thursday night, with the GFS showing a taper-off through the next morning. This would indicate snow in the mountains on Thursday evening, then rain changing to snow sometime overnight everywhere else - with any accumulations dependent on how long the precip lingers before temps drop below freezing.
|