| Home | Blog Index | Blog Archives | Christianity & Faith Essays | Storm Chasing Essays
850mb chart-watching season
Winter is the time when the 850 millibar chart is the most important model graphic I watch on a daily basis. 850mb is the part of the atmosphere a few thousand feet above the surface here in West Virginia. In fact, sometimes the highest elevations in the mountains can scrape the 850mb layer or even be completely inside it. (I have a more extensive explanation of 850mb and other atmospheric layers here if you're interested).
Anyway, I like the UCAR model outputs best for this, as they have a nice superimposition of the 850mb temp and humidity parameters. This makes it simple to see where 850mb dips below freezing and where the layer is at or near saturation (more likely to be producing precipitation). When 850s dip below 0°C and are close to 100% humidity, that is a signal for snow. Such as the NAM model is showing now for Thursday night:
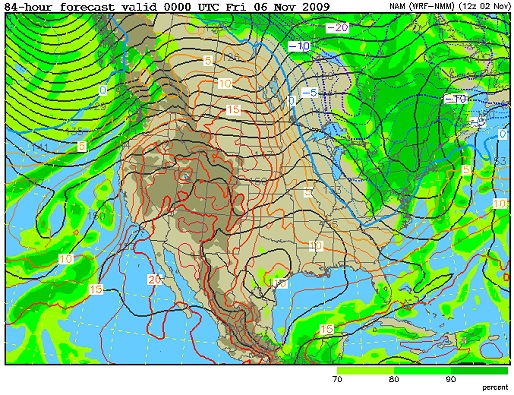
NAM 850mb chart for Thursday night
This is a typical Appalachian upslope pattern (detailed explanation here), with an upper trough swinging through and driving cold winds on its trailing side into the mountains. Remember, upslope winds have a cooling and moistening effect - encouraging saturation and precip formation at 850mb (given enough ambient moisture). This is why the humidity parameter above extends 850mb near-saturation values far to the south along the mountains.
Again, while the 850mb charts are the first thing I look at, there is more to the story. Any snow at that level can't do much if it doesn't make it to the ground. So we need to look at the surface temps.
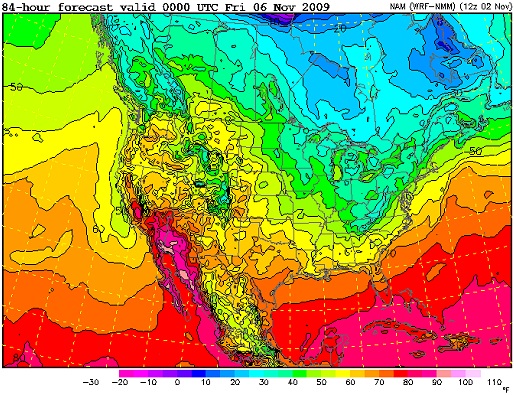
NAM surface temps for Thursday night
The NAM has the 35°F isotherm (line) at around 2500 feet there at 7PM Thursday evening. Looking at another model, the GFS, shows nearly the same thing - this is what we call 'agreement' in two or more different models:
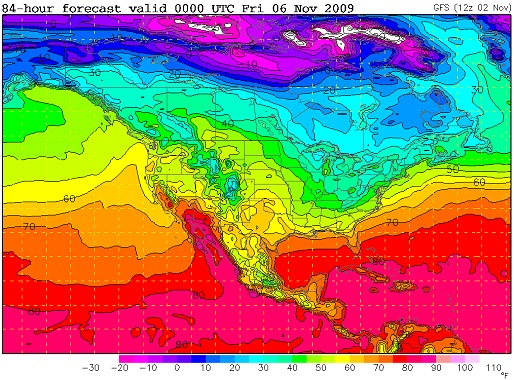
GFS surface temps for Thursday night
Now, the NAM model I'm using here only goes out to 84 hours (Thursday evening). Looking at the next frame on the GFS (which goes out much farther) for Friday morning shows below-freezing temps areawide (the 30°F isotherm is encircling the entire state):
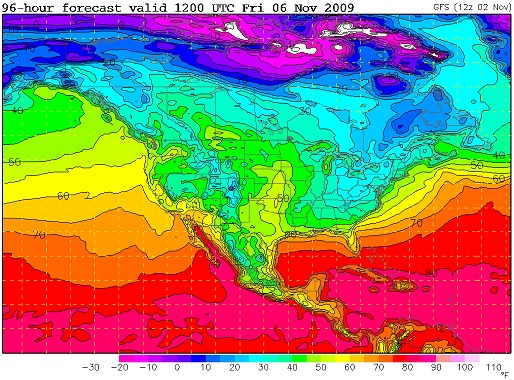
GFS surface temps for Friday morning
Both models show precip across WV on Thursday night, with the GFS showing a taper-off through Friday morning. This would indicate snow in the mountains on Thursday evening, then rain changing to snow sometime overnight everywhere else - with any accumulations dependent on how long the precip lingers before temps drop below freezing.
|