The best times and places to see tornadoes, using storm chasing stats
I'm often asked the questions of how many tornadoes I've seen, and how difficult they are to see. Another common question involves the best times and places to see a tornado. I'm a stats/numbers type person, so I have always kept data on the tornadoes I've witnessed over the past 34 years of storm chasing. I thought it might be a fun exercise to break that data down into tables by state, region, year and month to show what dates and locations have been the most productive in terms of easily-observable tornadoes. (This article's stats are updated at regular intervals - last update was June 13, 2026.)
The short answer: The best time of year to attempt to see a tornado is during the month of May. The state of Kansas produces both the highest number total tornadoes and the most visually-spectacular tornadoes for the storm chaser actively going out to attempt to see one.
As for personal stats, as of today I've seen 203 tornadoes. I've averaged seeing a tornado on one out of a little more than every four tornado attempt days. On average, one out of every 5 tornadoes I see is "photogenic" (well-developed with good lighting and contrast). Some years have been better than that, others were worse (some I saw zero tornadoes!). On average, I put in around 12 tornado "attempt" days per year (not including travel days). From the time I decided to start pursuing tornadoes in 2001, it took me three years of active storm chasing before I gained enough knowledge and skill to start seeing tornadoes.
The long answer: Below are tables breaking down tornado days by region, month, state and year. For the purpose of this data set, I'm not counting my numerous other outings for lightning, flooding, winter storms or general storm structure (those total in the dozens per year). This data also shows the average number of days one must go out to see a tornado in different regions of the USA and at different times of year.
Before I get into the tables, here is how I define the metrics and data categories:
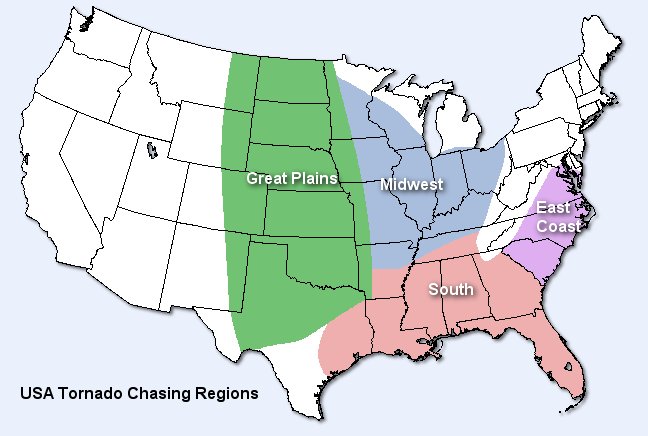
- USA Tornado Chasing Regions: For the purposes of this post, I'm only highlighting regions where you have multiple realistic chances to see a tornado each year, if you are able to chase when the conditions come together. This map plots what I consider to be the USA's four viable tornado-observing regions:
Annual Averages
Great Plains averages are calculated beginning in 2001. Midwest averages are calculated beginning in 2010, the year I moved to and began regularly storm chasing in that region.
|
| Metric |
Overall
Average |
Great Plains
Average |
Midwest
Average |
| Tornadoes |
7.4/year |
5.6/year |
3.1/year |
| Photogenic Tornadoes |
1.9/year |
1.9/year |
Every 2.8 years |
Tornado Attempt
Days |
13.6/year |
6.1/year |
12.7/year |
| Tornado Days |
3.2/year |
2/year |
1.9/year |
| Tornadoes Per Tornado Day |
2.3 |
2.8 |
1.6 |
| Tornado Attempt Mileage |
7,852/year |
|
|
Tornadoes by Region - Leader: Great Plains
The Great Plains in the spring is by far the most 'bang for your buck' in terms of the probability that you'll see a tornado on any given storm chase day. Overall, it takes twice as many storm chase days to see a tornado in the Midwest than the Great Plains, but each Midwest attempt tends to involve half of the mileage of a typical Great Plains trip. All but 3 of the Midwestern tornadoes I've seen occured less than 2 hours from home!
|
| Region |
Tor
Attempt
Days |
Tor
Days |
Tors |
Photo-
genic
Tors |
Success
Rate |
%
Photo-
genic |
Great
Plains |
150 |
48 |
131 |
42 |
35.3% |
32.1% |
| Midwest |
213 |
36 |
72 |
11 |
16.5% |
16% |
| South |
2 |
0 |
0 |
0 |
0% |
0% |
| East |
4 |
0 |
0 |
0 |
0% |
0% |
| All |
368 |
83 |
203 |
53 |
23% |
26.5% |
|
Tornadoes by Month - Leader: May
Of course, spring is the dominant season for severe storms, with May predictably on top for total tornadoes and the most photogenic tornadoes. Of note is the fact that I have had at least one tornado storm chase day in every month of the year, a consequence of living in the Midwest where many events are scattered throughout the entire year. All of my top 5 tornado intercepts have occurred in May.
|
| Month |
Tor
Attempt
Days |
Tor
Days |
Tors |
Photo-
genic
Tors |
Success
Rate |
%
Photo-
genic |
| January |
2 |
0 |
0 |
0 |
0% |
0% |
| February |
7 |
3 |
4 |
1 |
42.9% |
25% |
| March |
21 |
3 |
7 |
1 |
14.3% |
14.3% |
| April |
61 |
12 |
35 |
11 |
18.3% |
50% |
| May |
105 |
42 |
97 |
27 |
41% |
28% |
| June |
40 |
16 |
42 |
9 |
38.5% |
24.3% |
| July |
15 |
4 |
9 |
1 |
26.7% |
12.5% |
| August |
3 |
0 |
0 |
0 |
0% |
0% |
| September |
4 |
2 |
2 |
1 |
50% |
50% |
| October |
4 |
1 |
1 |
0 |
25% |
0% |
| November |
6 |
1 |
1 |
0 |
16.7% |
0% |
| December |
4 |
3 |
6 |
2 |
75.0% |
33.3% |
| All |
368 |
83 |
203 |
53 |
23% |
26.5% |
|
Tornadoes by State - Leader: Kansas
The leader in this category is no surprise: Kansas is the best state to spend time and money trying to see tornadoes in, with the greatest number of tornadoes, most photogenic tornadoes and best overall success rate. But on this list, Illinois is catching up - in 2021, IL passed Oklahoma to gain second place for total tornado sightings. Also of note here is the surprising difficulty I've had seeing tornadoes in Missouri, despite a high number of tornado attempt days there (ranked number 3 in that category!). Part of this is due to the road network and terrain, but it's mostly because storms over there have simply not been very productive like they have in the states on either side.
I didn't include mileage in this category, as chase days frequently involve multiple states. Trying to go back through each individual storm chase day to break all of those numbers down by state would be too time-consuming a task for this purpose.
|
| State |
Tor
Att-
empt
Days |
Tor
Days |
Tors |
Photo-
genic
Tors |
Success
Rate |
%
Photo-
genic |
| Kansas |
39 |
17 |
54 |
15 |
38.5% |
31.3% |
| Illinois |
109 |
28 |
42 |
6 |
25% |
17.2% |
| Oklahoma |
48 |
11 |
29 |
5 |
22.9% |
20% |
| Texas |
22 |
9 |
19 |
5 |
40.9% |
26.3% |
| Nebraska |
17 |
10 |
18 |
8 |
59% |
44.4% |
| Iowa |
9 |
3 |
10 |
6 |
33.3% |
60% |
| Missouri |
53 |
8 |
10 |
0 |
13.5% |
0% |
| Indiana |
13 |
6 |
10 |
2 |
46.2% |
22.2% |
| Colorado |
9 |
4 |
8 |
3 |
44.4% |
37.5% |
| Wyoming |
0 |
1 |
2 |
1 |
100% |
50% |
| South Dakota |
2 |
1 |
1 |
0 |
50.0% |
0% |
| Kentucky |
7 |
0 |
0 |
0 |
0% |
0% |
| Ohio |
2 |
0 |
0 |
0 |
0% |
0% |
| Tennessee |
2 |
0 |
0 |
0 |
0% |
0% |
| Arkansas |
2 |
0 |
0 |
0 |
0% |
0% |
| North Carolina |
2 |
0 |
0 |
0 |
0% |
0% |
| West Virginia |
2 |
0 |
0 |
0 |
0% |
0% |
| Alabama |
1 |
0 |
0 |
0 |
0% |
0% |
| Louisiana |
1 |
0 |
0 |
0 |
0% |
0% |
| North Dakota |
1 |
0 |
0 |
0 |
0% |
0% |
| All |
368 |
83 |
203 |
53 |
23% |
26.5% |
|
Tornadoes by Year - Leader: 2024
This table only goes back to 2001, since that was the first year I expanded from just covering lightning to pursuing tornadoes and supercells. Prior to that, I was going out strictly for lightning photography.
*My 2020 spring tornado season was mostly shut down due to the pandemic. COVID travel restrictions in Illinois from March 23 to May 29 prevented me from leaving the St. Louis metro area during the peak of severe weather season.
**Mileage shown is for tornado attempts only (this figure does not include mileage traveled for other weather phenomena such as winter storms, hurricanes, lightning and floods).
|
| Year |
Tor
Att-
empt
Days |
Tor
Days |
Tors |
Photo-
genic
Tors |
Success
Rate |
%
Photo-
genic |
Mile-
age** |
Avg.
Miles
per
Tor |
| 2001 |
4 |
0 |
0 |
0 |
0% |
0% |
4,178 |
- |
| 2002 |
5 |
0 |
0 |
0 |
0% |
0% |
3,983 |
- |
| 2003 |
10 |
0 |
0 |
0 |
0% |
0% |
11,136 |
- |
| 2004 |
13 |
6 |
12 |
4 |
46.2% |
33.3% |
|
|
| 2005 |
8 |
3 |
14 |
2 |
37.5% |
14.3% |
11,893 |
849.5 |
| 2006 |
6 |
1 |
1 |
0 |
16.7% |
0% |
8,065 |
8,065 |
| 2007 |
6 |
3 |
15 |
0 |
50% |
0% |
10,243 |
682.9 |
| 2008 |
6 |
2 |
4 |
0 |
33.3% |
0% |
4,962 |
1,240.5 |
| 2009 |
7 |
0 |
0 |
0 |
0% |
0% |
5,249 |
- |
| 2010 |
15 |
3 |
6 |
0 |
20% |
0% |
7,837 |
1,306.2 |
| 2011 |
10 |
2 |
2 |
1 |
20% |
50% |
4,247 |
2,123.5 |
| 2012 |
12 |
3 |
11 |
5 |
25% |
45.5% |
7,244 |
658.5 |
| 2013 |
22 |
6 |
12 |
4 |
27.3% |
33.3% |
9,189 |
765.8 |
| 2014 |
10 |
6 |
10 |
1 |
60.0% |
10% |
9,709 |
970.9 |
| 2015 |
14 |
4 |
6 |
0 |
28.6% |
0% |
9,725 |
1,620.8 |
| 2016 |
11 |
4 |
17 |
5 |
36.4% |
29.4% |
6,741 |
396.5 |
| 2017 |
11 |
5 |
9 |
4 |
45.5% |
44.4% |
6,439 |
715.4 |
| 2018 |
15 |
4 |
11 |
3 |
26.7% |
27.2% |
10,654 |
968.5 |
| 2019 |
24 |
5 |
8 |
3 |
20.8% |
37.5% |
13,674 |
1,709.3 |
| 2020* |
8 |
0 |
0 |
0 |
0% |
0% |
1,945 |
- |
| 2021 |
17 |
6 |
12 |
2 |
35.3% |
16.7% |
10,305 |
858.8 |
| 2022 |
14 |
1 |
1 |
0 |
7% |
0% |
6,721 |
6,721 |
| 2023 |
21 |
2 |
2 |
0 |
9% |
0% |
6,737 |
3,368.5 |
| 2024 |
36 |
13 |
28 |
12 |
36.1% |
44% |
18,441 |
658.6 |
| 2025 |
6 |
3 |
4 |
0 |
50% |
0% |
1,455 |
485 |
| 2026 |
11 |
4 |
13 |
4 |
30% |
40% |
8,166 |
817 |
| All |
368 |
83 |
203 |
53 |
23% |
26.5% |
192,001 |
960 |
|
I'd be interested to hear if your tornado day to tornado storm chase day rates are similar to mine.
 About the Author: Dan Robinson has been a storm chaser, photographer and cameraman for 34 years. His career has involved traveling around the country covering the most extreme weather on the planet including tornadoes, hurricanes, lightning, floods and winter storms. Dan has been extensively published in newspapers, magazines, web articles and more, and has both supplied footage for and appeared in numerous television productions and newscasts. He has also been involved in the research community, providing material for published scientific journal papers on tornadoes and lightning. |
Wow! Great stats. My last 3 years as follows:
Event Days. Tornado Days. Tornadoes. Success
2011. 5. 1. 3. 20%
2012. 1. 0. 0. 0%
2013. 7. 5. 8. 62.5%
- Posted by Clarence from Nashville, Tn | | |
|
|